Have you ever tried to convince your team, your boss, or your leadership that you need to make changes in order to improve things at work?
Perhaps you’ve argued for upgrading to the latest version of Java, updating the libraries or frameworks the application uses, or getting budget for a tool that will make your life easier.
Did they listen to your arguments?
While your team may have been sympathetic to your needs, perhaps your boss needed to see more data about the problem, or the leadership team wanted to see what the expected ROI was on the investment.
As developers, we understand the value of data. We collect it on the performance of our applications, use it to find out how our users are behaving and how to improve their experiences, and monitor our apps to anticipate problems before they strike. However, we’re often living in a data vacuum when it comes to things that impact developer productivity and the overall experience.
For example, most of us can probably give an approximate answer to “How long does it take to build and test the applications that you work on?” Yet, if you ask a developer if their local build time is better or worse than the others in their team, the answer will probably be “I’ve never even thought about it”.
What if your build time is significantly longer than your teammates’? Wouldn’t you want to know about that and get help reducing it? Why should you suffer?

Develocity Build Scan® shows build times for local builds, letting you see if you have issues with your build performance
A large part of build times is often the time taken to run the automated tests. When everything goes green, that makes us feel great.
But how often does the build go green? Do tests frequently fail? Are they really failing, or do you have flaky tests? How much time do you lose trying to debug failing tests? How often does it happen? Is it only you that’s affected, or is the rest of the team equally frustrated?
It’s these kinds of problems that introduce friction and toil into our jobs as developers. We’re not working on the fun stuff, we’re distracted by the “side quests” of troubleshooting problems and dealing with the fallout of failing (or not-really-failing) tests. Worse, we often don’t even realize that we’re doing this, or how much time is spent on these kinds of tasks. And when leadership asks, “Why does it take so long to ship new features?”, we can answer with gut feelings and whatever problems we remember facing in the last week or two, but we don’t always have data to show them what’s really slowing us down. Without this data, we might not see that an investment in the toolchain or our hardware could save us days and days of lost time.

A Build Scan lets you see who else is affected by the same issues you face
When we do have solutions to the toil and friction affecting our developer experience, it’s often dismissed as “those developers wanting to play with new toys”.
I spent several years talking to developers about the benefits of using whatever the latest version of Java was. Whenever I gave talks on the topic, developers kept telling me they wouldn’t be upgrading to the latest version any time soon because “management” couldn’t see the value in spending time doing a “risky” upgrade so that developers could “play” with the latest features.
These developers would ask me for advice on how to persuade their bosses that the benefits were worth it.
The answer is, of course, data. How much faster will the application run using the latest JVM? How much more secure will the application be if it’s using dependencies which are fully up to date with the latest security patches? How much easier will it be to code features or fix bugs using the latest version of Java? How will it impact recruitment if candidates find out they’ll have to work using an old version of Java?
This data doesn’t have to be some convenient performance tests from a JVM vendor who wants to sell you a subscription to their specific JVM. What if you could get it from within your own organization?
Large organizations always have teams working with all kinds of tech stacks, using various combinations of tools to achieve different goals. What if there was a way to point your manager to another team in your organization who’s using the tools you want to use, or taking the approach you want to take, and show them that it works well for your business? What if you could counter the argument “but our standard JVM is version x” by demonstrating your organization already uses version y? What if you could show your management that there are teams in the organization that have shorter build times, fewer test failures and faster time to release, and learn from those teams how to improve your own working environment?

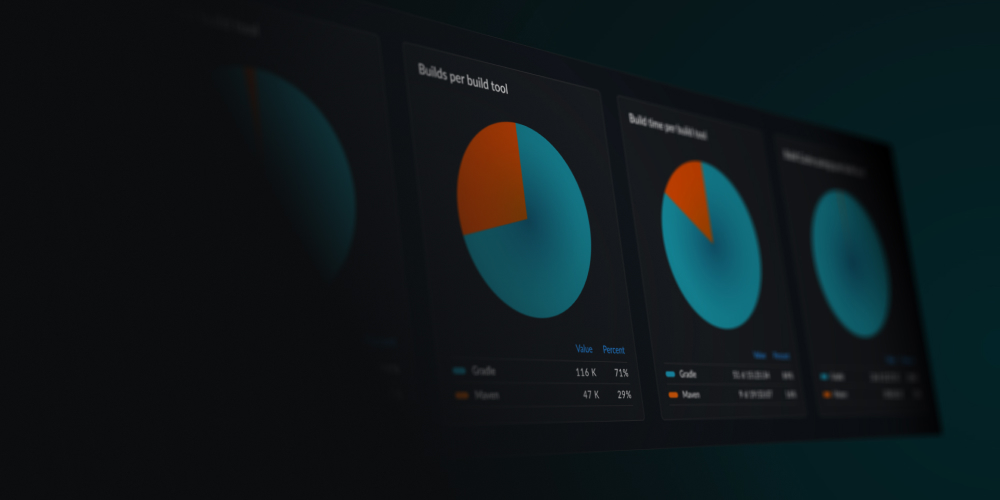
Develocity Reporting & Visualization lets you see which JVMs are being used across your organization
When your boss says, “Bring me solutions, not problems”, they’re also looking for evidence that a) there is a problem and b) your solution addresses that problem. To do this, you need data. You need data to show what is introducing friction and toil into your job. You need data to show the risks that exist from using outdated tools. And you need data to show that your solutions can fix these issues, and perhaps even have fixed these issues in other parts of your organization.
Data is the tool you need to get what you deserve.

