Introducing Develocity Reporting & Visualization for improved build and test observability
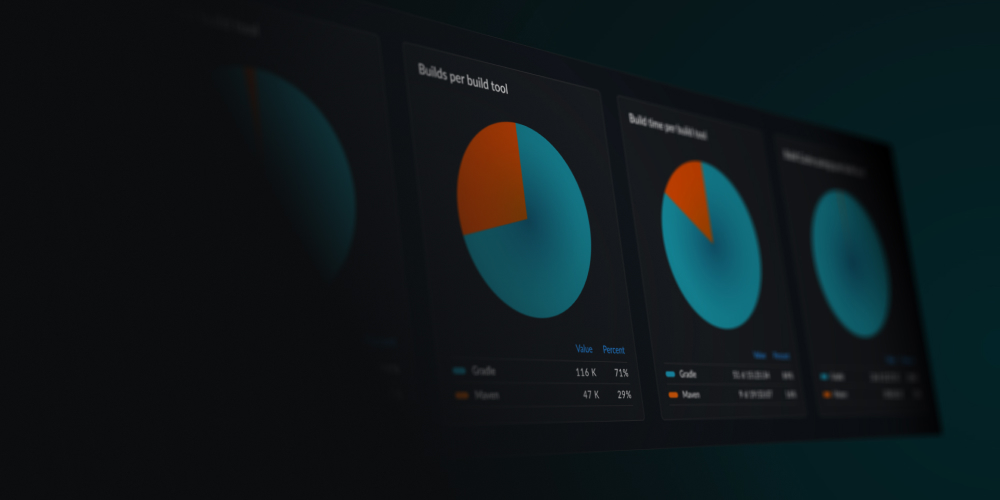
By Trisha GeeWe’re excited to announce a new capability for Develocity called Reporting and Visualization. The data that Develocity collects and collates is so valuable for providing insights into developer team productivity that we thought it essential to make it even easier to access, understand, and query. While it uses a familiar toolchain for querying and reporting the local and CI build data available in Develocity, the data is then fed into Grafana, so you can use the full power of a tool designed for visualizing and understanding data.
Read More →