 Accelerate
 Troubleshoot
 Observe
The software industry is at an inflection point. Engineering organizations face unprecedented challenges in ensuring developer productivity, software supply chain security, and CI/CD pipeline performance efficiency. Developer Productivity Engineering (DPE 1.0) has already revolutionized the way teams optimize builds & tests through caching, test parallelization, and shorter feedback loops to prevent developer context switching, but the next phase—DPE 2.0—requires a more comprehensive approach.
At the heart of this evolution is Toolchain Observability. At Gradle, we work with enterprise development teams worldwide, helping them improve their engineering and developer efficiency. The critical missing piece in today’s CI/CD and build optimization strategies is end-to-end artifact observability across the entire software toolchain. With Toolchain Observability, engineering teams can gain real-time insights, shift-left the enforcement of software governance & compliance policies, and elevate developer productivity using a data-driven approach to decision making.
This article dives into different aspects of the thinking process of Toolchain Observability adoption so you can understand how DPE 2.0 is setting the foundation for the next decade of developer productivity advancements.
Why Toolchain Observability now
The growing complexity of software toolchains
According to DORA’s State of DevOps Report, modern software engineering is becoming more sophisticated daily, with countless frameworks, design patterns, and AI augmentations (survey from GitHub). Teams rely on distributed toolchains, hybrid cloud environments, and open-source dependencies, introducing significant security, compliance, governance, performance, and productivity challenges.
“Trust platforms, verify artifacts” (SLSA Principles) emerges as the best practice for the DevOps approach. This places premium value on understanding the internal processes and activities of DevOps platforms or toolchains. Without deep visibility into the toolchains, organizations struggle to:
- Diagnose CI/CD pipeline inefficiencies, build & test failures, and troubleshoot issues in complex enterprise multi-cloud software supply chain environments.
- Ensure artifact integrity, security, governance, compliance, and provenance throughout the SDLC.
- Manage CI/CD pipeline costs by optimizing resource-intensive build and test cycles.
Security and compliance pressures have intensified
Software Governance, Compliance, and Deployment best practices such as SLSA Provenance, SBOM mandates, and zero-trust security models require organizations to:
- Track software artifact provenance to prevent and mitigate supply chain attacks (e.g., SolarWinds, Log4j or Log4Shell, XZ Utils).
- Enforce cryptographic signing and verification across all configurations, resources, and artifacts.
- Implement automated governance policies to reduce manual compliance overhead as early as possible within the SDLC.
Toolchain Observability becomes one of the foundational DevOps infrastructure services, which can provide timely insights to enable additional scalable and automated solutions to meet these demands and provide faster response for security incidents; improving compliance adherence, and enabling data-driven engineering decisions.
Toolchain Observability and its role in DPE 2.0
What is Toolchain Observability?
Toolchain Observability surfaces the insights and enables the capability to track, analyze, and optimize the usage of artifacts at every stage of software builds, tests, and deployments. Unlike traditional application observability, which focuses on the application performance and customer negative-impact avoidance, Toolchain Observability focuses on:
- Artifact Observability: Ensuring full artifact identity tracking through SDLC quality gates, from source code to deployment.
- Build & Test Performance Intelligence: Detecting bottlenecks in CI/CD pipelines, optimizing caching, and reducing flakiness in automated tests.
- Security and Compliance Enforcement: shift-left policy validation for first-party dependencies (e.g. libraries you created), open-source dependencies, build environment, cryptographic artifact integrity, toolchain governance, and compliance controls.
The role of the Toolchain Observability platform
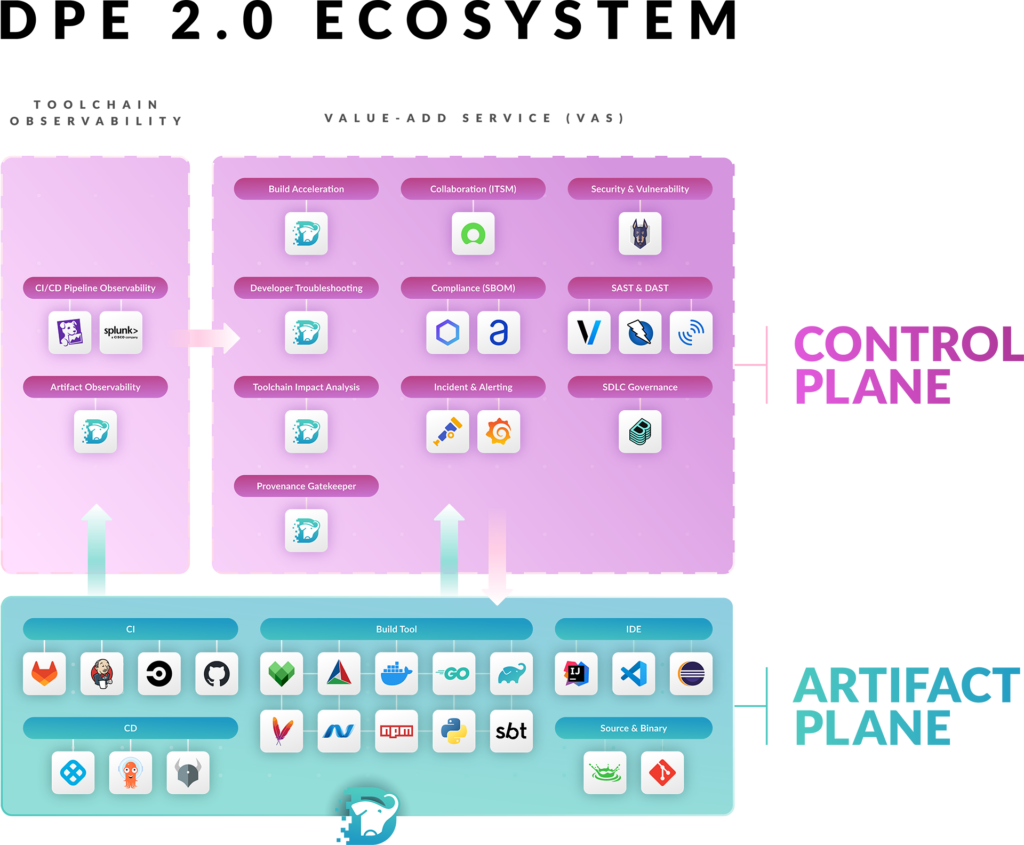
To make Toolchain Observability actionable, organizations need an integrated Toolchain Observability Platform like Develocity®, which provides functions in each of the following market segmentations:
- Toolchain Artifact Plane: artifact telemetry collection from builds, tests, CI/CD pipelines, artifact repositories, and dependency managers using tools like Develocity Build Scan®.
- Toolchain Observability Plane: enable artifact and CI/CD pipeline governance enforcement for security, compliance, and build/test performance through analytics from the artifact telemetry data collected in the Toolchain Artifact Plane.
- Toolchain Value-Added Services (VAS) Plane: An application ecosystem for continuous innovation in build performance, test automation, software supply chain analytics, and continuous SDLC quality monitoring and enforcement by either directly interacting with the Toolchain Artifact Plane or through analytic data from the Toolchain Observability Plane.
Toolchain Observability unlocks the full potential of DPE 2.0
Advancing developer productivity
DPE 1.0 focuses on accelerating builds, shortening developer feedback and troubleshooting loops, and minimizing the developer’s context switching, while DPE 2.0 enables proactive SDLC optimization with toolchain analytics. With Toolchain Observability, development teams can:
- Reduce artifact troubleshooting time by automatically pinpointing build & test failures across complex toolchains.
- Enable self-healing software governance & software compliance with AI-driven policy enforcement.
- Shift left to deliver actionable insights directly to developers to prevent performance impacts through build & test analytics as soon as possible.
Reducing enterprise software governance & compliance risk
Increasingly complex modern software supply chains makes it complicated to ensure compliance and governance across build systems, CI/CD pipelines, and artifact repositories across many changing vendors. Toolchain Observability enables enterprises to enforce security policies, monitor software artifact integrity, and meet compliance requirements with minimal operational overhead for production deployment. Benefits for CIOs & CISOs:
- CIOs can gain data-driven insights to reduce DevOps spending, improve software delivery efficiency, and enforce engineering best practices.
- CISOs can enforce continuous monitoring of software artifacts, ensuring that all binaries meet security compliance before and after production deployment.
Accelerating innovation and minimizing technical debt with faster development cycles
As enterprises scale software development, innovation velocity is constrained by inefficient build/test speed, slow debugging cycles, and technical debt accumulation. Toolchain Observability unlocks faster development cycles while preventing technical debt from slowing down engineering teams through:
- Optimize developer workflows by reducing friction in debugging, test execution, and build validation.
- Automate software governance and compliance policies to prevent security regressions.
- Fostering a vibrant Value-Add Service (VAS) ecosystem to enhance collaboration between security, compliance, and Dev & Ops engineering teams.
Implementing Toolchain Observability in your organization
Key steps for DPE 2.0 adoption
- Instrument Your Toolchain: Collect artifact telemetry from build systems, CI/CD workflows, and artifact repositories using Develocity Build Scan.
- Adopt a Toolchain Observability Platform: Leverage Develocity to unify build & test metadata, dependency management, and optimization analytics.
- Shift-left and automate software Governance & Compliance: Enforce SLSA Provenance, SBOM validation, and zero-trust security models throughout the SDLC.
- Leverage AI for Predictive Development Engineering: Implement anomaly detection for build time regressions, build failures, flaky tests, and security threats.
Measuring the Impact of Toolchain Observability
To measure the ROI of Toolchain Observability, enterprises should track key performance metrics across developer productivity, software governance & compliance, and toolchain cost optimization.
| Metric | Why It Matters | Target Impact with Toolchain Observability |
|---|---|---|
| Mean Time To Recovery (Reduction for Build & Test Failures) | Improves developer efficiency and feedback cycles | 40-60% faster resolution |
| Artifact Compliance Coverage (SBOM, SLSA Provenance, Zero-Trust) | Ensures software integrity and traceability | 100% compliance automation |
| CI/CD Pipeline Efficiency | Reduces unused cloud resources & speeds up pipeline execution | 20-40% lower CI/CD costs |
| Return on Capacity (Reduction in Build & Test Time) | Accelerates feedback loops for engineers | 30-50% improvement |
| Time to Extract (Reduction for Incident Response Time) | Faster risk detection and mitigation | 50% faster response |
DPE 2.0 is Here—Powered by Toolchain Observability
In the last couple of years, the Developer Productivity Engineering movement has reshaped software delivery’s landscape. DPE has been adopted by some of the world’s most admired brands, including Apple, Google, Meta, Uber, American Airlines, Spotify, Intuit, and many others.
Now, DPE 2.0 will further the cause by making Toolchain Observability the foundation for security, software governance, compliance, and continuous developer productivity improvement.
At Gradle, we see Toolchain Observability as the key enabler of engineering excellence. Organizations that adopt a Toolchain Observability platform like Develocity will reduce DevOps toolchain costs, improve developer experience, and accelerate innovation velocity.
To make Toolchain Observability a core part of your engineering strategy, we invite you to request a guided trial of Develocity.