Writing tests is hard. Fixing them is harder. Join the webinar.
Gradle Enterprise 2017.4
2017.4 adds powerful new tooling for understanding and debugging build caching and incremental building, along with many other new features that aid in day-to-day development and build optimization. In particular, task output origin links provide a new level of traceability that you will wonder how you ever lived without.
Read on for the details of the new features and improvements.
Use version 1.8 of the build scan plugin with this version of Gradle Enterprise for optimal build scans.
Highlights
Trace reused task outputs to their origin
Gradle’s incremental build and build caching features make builds faster by reusing outputs from previously run builds. For tasks that reused output, if a build scan is in the system for the build that produced the output, you can now easily learn all about that build.

The new task details pane, shown when clicking on a task in the “Timeline” section, includes a link to the task that originally produced the output.
Knowing all about the build that produced the reused output aids in diagnosing and debugging reuse problems, such as missing input declarations.
Understand differences in task inputs between two builds
Building upon the build scan comparison functions added in earlier Gradle Enterprise versions, you can now inspect the differences in inputs between two builds. This is useful for debugging incremental build and build cache issues.
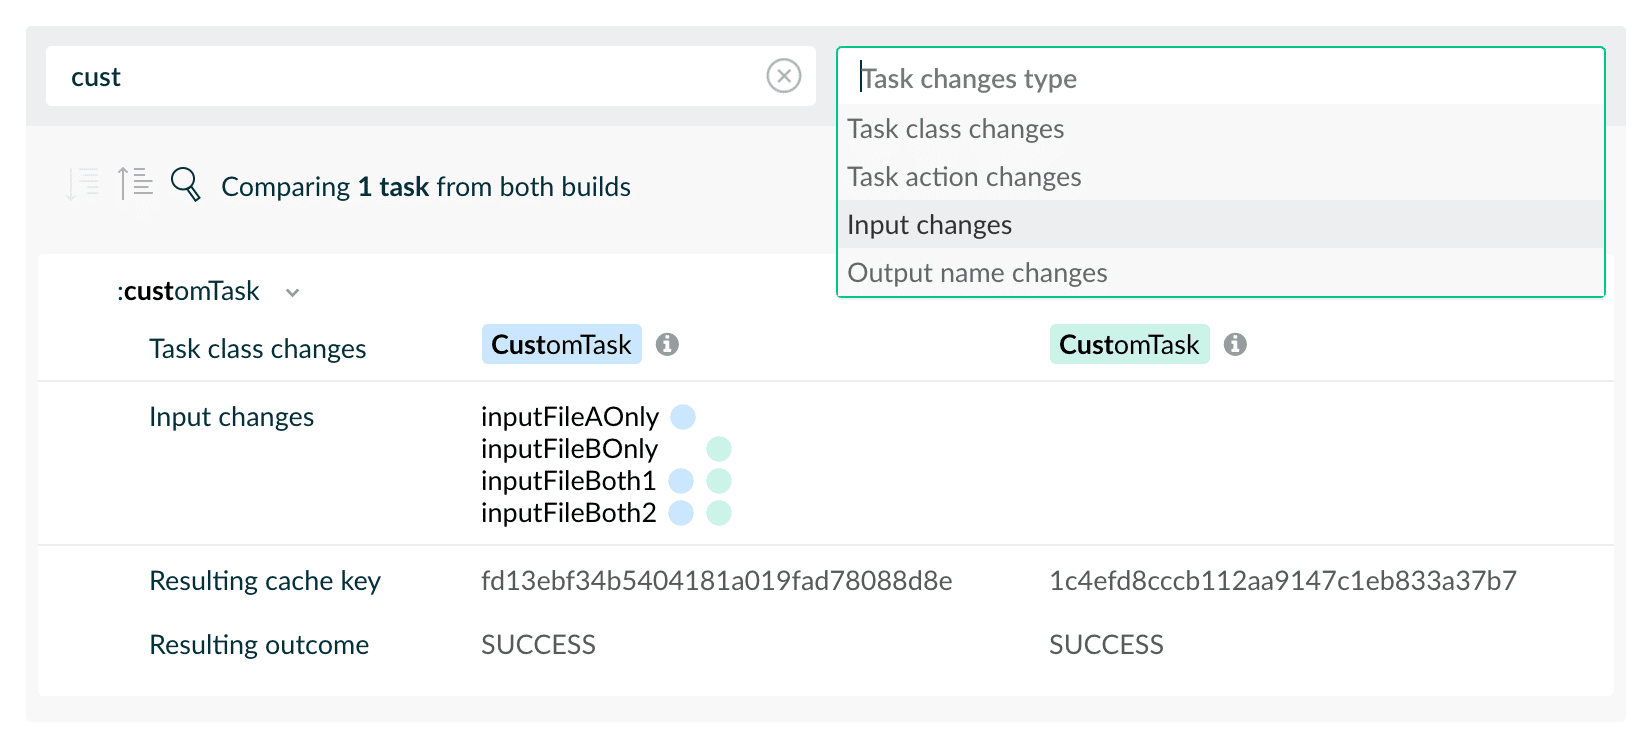
Tasks with the same task path in both builds are compared. Differences in the task implementation are highlighted, along with the task properties that were different.
Understand why a task was executed
The new task details pane, available by clicking on a task in the “Timeline” section, includes why a task was not up-to-date.

This is useful information for reasoning about build performance and incremental building.
View build cache configuration
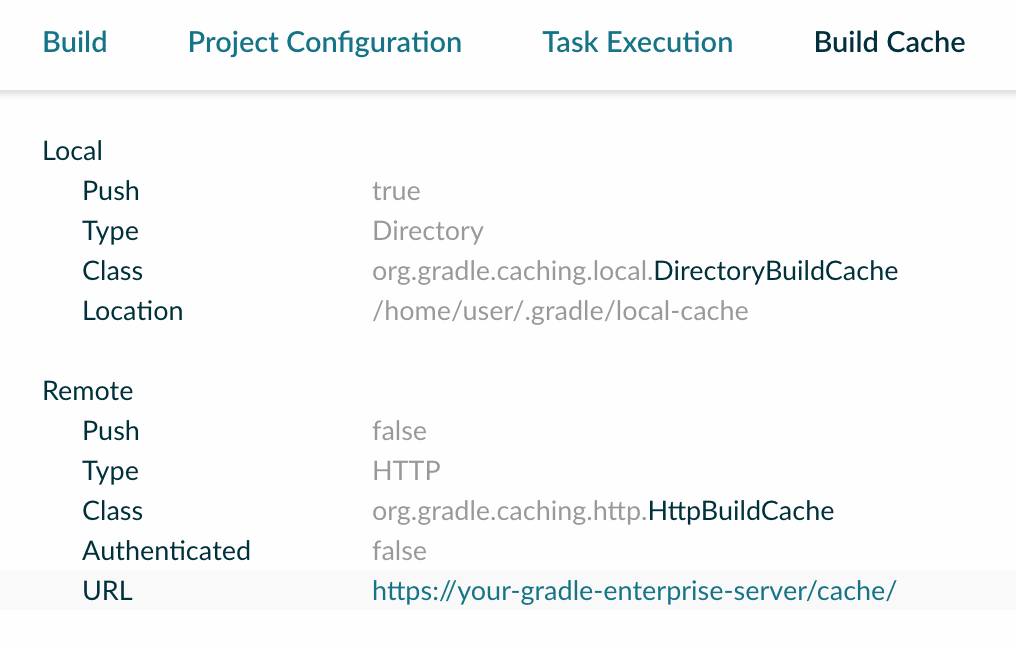
The existing “Performance” section has been updated with a new “Build Cache” tab that shows the effective build cache configuration for the build.
Focus on risky dependencies
The existing dependency search function has been improved to allow filtering the shown dependencies to just those that were specified with dynamic versions, or that were resolved to a different dependency than what was requested, due to conflict resolution or substitution rules.

Dynamic dependencies are often the cause of problems as they may change unexpectedly. Dependencies that were the subject of conflict resolution or substitution rules can cause problems due to incompatiblity between different library versions.
Compare custom values between builds
Custom values are a powerful tool at your disposal. They can be used to include any information that you want in build scans. You can now compare custom values between builds.

Diagnose under/over allocation of memory to Gradle
The “Build” tab of the “Performance” section now indicates the peak usage of each heap memory pool, and the amount of time spent doing memory garbage collection.
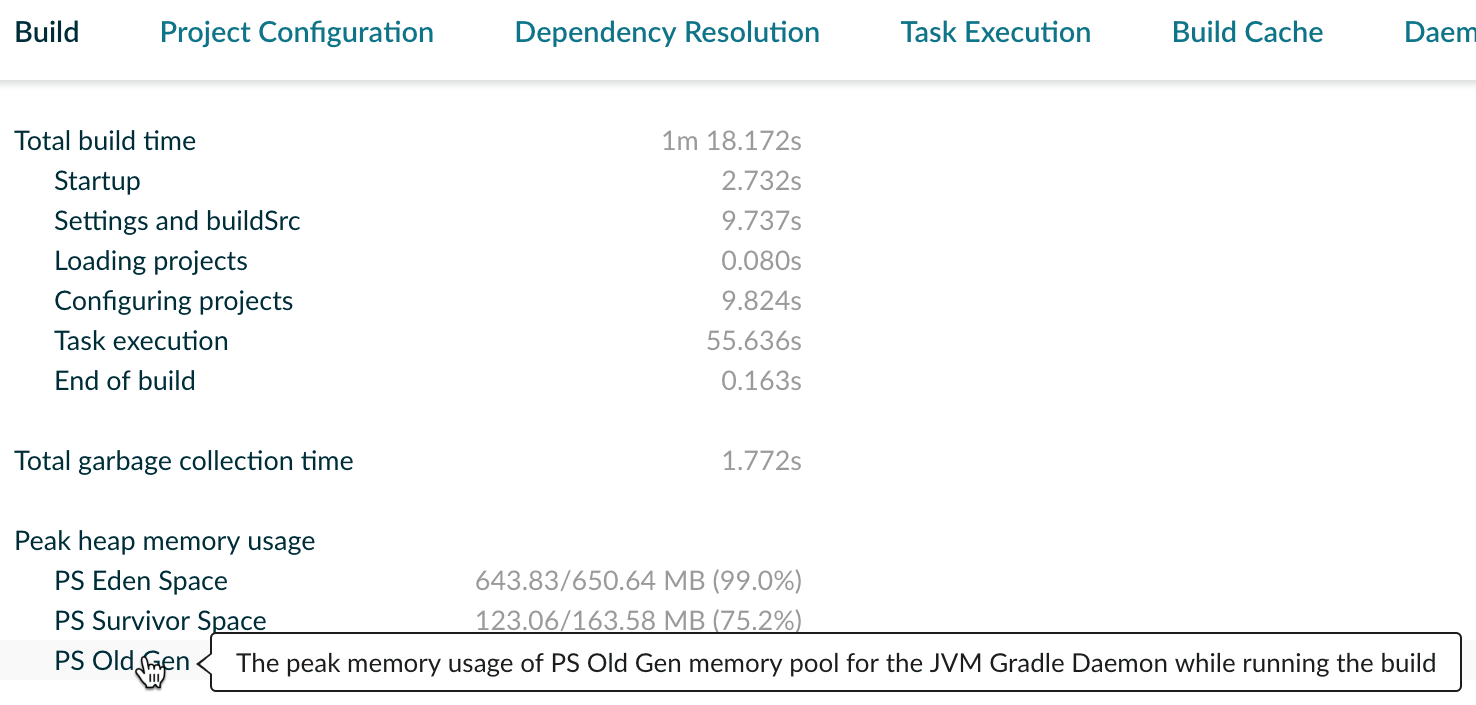
Peak usage close to the maximum allocation can indicate an under allocation, which may cause excessive garbage collection (indicated by a high garbage collection time metric) that will increase build times. Peak usage well below the maximum allocation can indicate an over allocation, which may cause longer, stop-the-world, full garbage collections that will also increase build times.
Finding the right allocation is a matter of experimentation and measurement. Generally, only very large builds require significant memory allocation tuning.
Optimize task concurrency and reduce build times
The task listing in the “Timeline” section can now be ordered by task duration or task execution order. This can be used to identify tasks that dominate the build execution time or to understand ordering issues when the build is run in parallel.

The graphical timeline visualization can help identify tasks that are limiting build concurrency, and are therefore good candidates for investing in optimization by either making them faster, have them run earlier, or breaking them up into smaller tasks.
Find builds by requested tasks
The build scan search function has been improved with the addition of a new search criterion: requested tasks. The requested tasks of a build are those tasks that were explicitly requested when invoking the build. The values matched are the task paths, after task name abbreviation expansion.
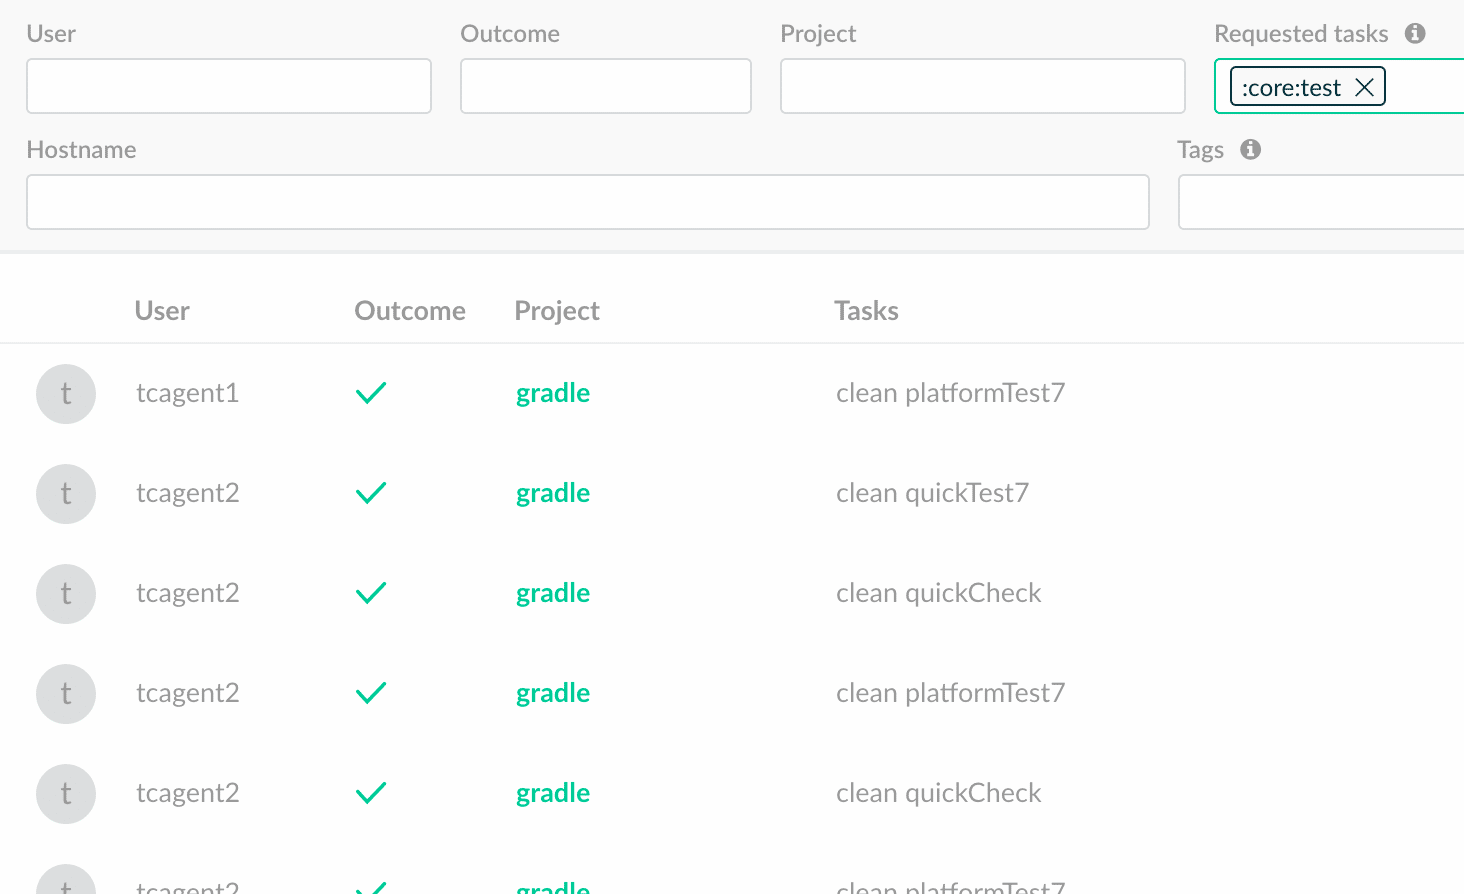
For example, invoking ./gradlew te could match the :core:test and :common:test tasks. A search for the requested task :core:test would find this build.
Deploy multiple build caches
Gradle Enterprise 2017.3 saw the addition of a bundled build cache backend. With 2017.4, you can now separately install and operate one or more build cache nodes and connect them to Gradle Enterprise for centralized management. The build cache node service is distributed as a Docker container, via Docker Hub, and can be easily installed on any Docker enabled machine with:
docker run -d -p 80:80 gradle/build-cache-node
Each build cache node is a discrete cache that can be used by Gradle builds as a cache backend. They can be used to separate cache artifacts, distribute load, or reduce cache load/store times by installing the cache node “closer” to where builds are run.
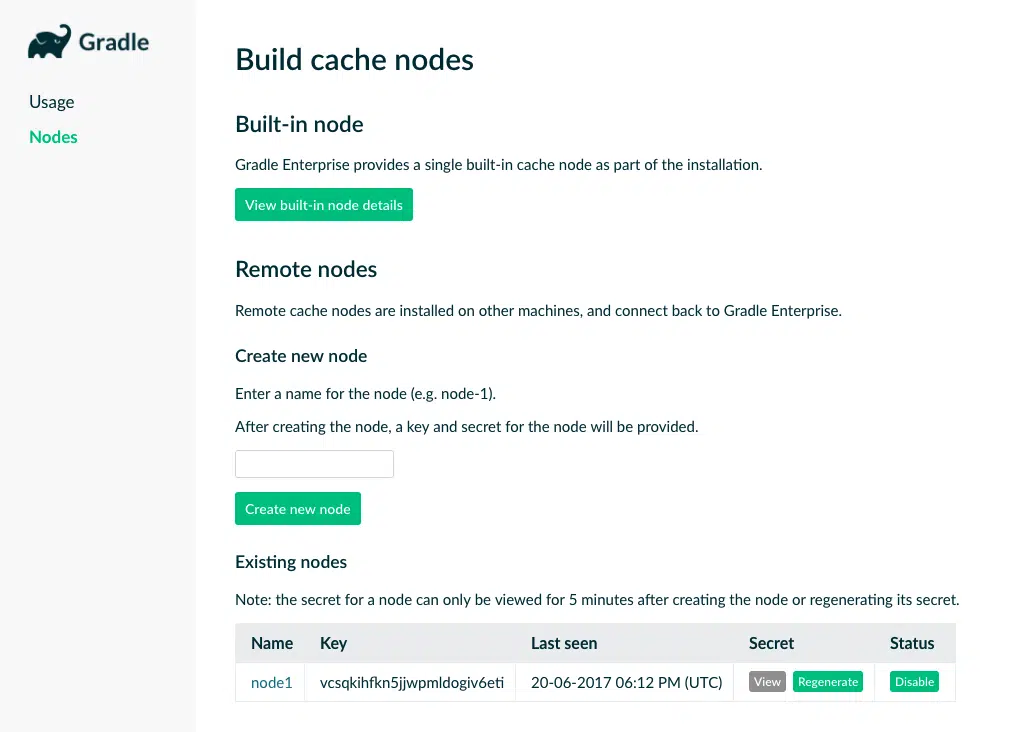
Cache nodes are registered with the Gradle Enterprise cache admin application, from which their usage can be monitored and their operational settings configured. For more information, please see the Gradle Enterprise Admin Manual.
A built-in cache node is bundled with Gradle Enterprise. If you are upgrading from Gradle Enterprise 2017.3, your build cache usage will continue to work without changes.
Capture the build scan URL at build time
Not a feature of Gradle Enterprise per se but of build scan plugin 1.8, you can now programatically capture the URL of the published build scan from within your build. This can be used, for example, by CI tools to surface the build scan URL more prominently.
See the Gradle Build Scan Plugin User Manual for more information and example usage.
Upgrade notes
The 2017.4 release includes several new data indexes, and an update to the index used by the scan list search function. After upgrading, the build scan service will create the new indexes and update the scan list index in the background. During this time, only re-indexed scans will be available as search results, and system load will be higher than usual.
For large installations, this process may take several hours. The service will however be fully functional during this process.
Changes
- [FIX] Export API returns no events for build when no event type filter is applied.
- [FIX] Expanding dependencies in dependencies details view may behave incorrectly.
- [FEATURE] Create build scans with build scan plugin version 1.8.
- [FEATURE] Compare task inputs of two builds.
- [FEATURE] Compare custom values of two builds.
- [FEATURE] Understand your build cache configuration.
- [FEATURE] Create and administer several build cache nodes.
- [FEATURE] Link to origin task from tasks that reused outputs.
- [FEATURE] Sort tasks by duration or execution order.
- [FEATURE] See aggregate task duration for filtered tasks.
- [FEATURE] Search for dependencies with dynamic versions or substitutions.
- [FEATURE] Find builds by requested tasks.
- [FEATURE] Understand your build process memory usage.
- [FEATURE] Wire custom logic after a scan has been published.
- [ENHANCEMENT] Improved dependency comparison.
- [ENHANCEMENT] Improved timeline display performance.
- [ENHANCEMENT] Improved network activities listing.

