Writing tests is hard. Fixing them is harder. Join the webinar.
Gradle Enterprise 2018.4
New configuration time performance insights provide a more complete profile of configuration time, making it easier to find bottlenecks. In particular, profiling of lifecycle callbacks, e.g. afterEvaluate(), and attribution to the plugins and scripts that registered them allow identifying slow callbacks that were previously hard to discover.
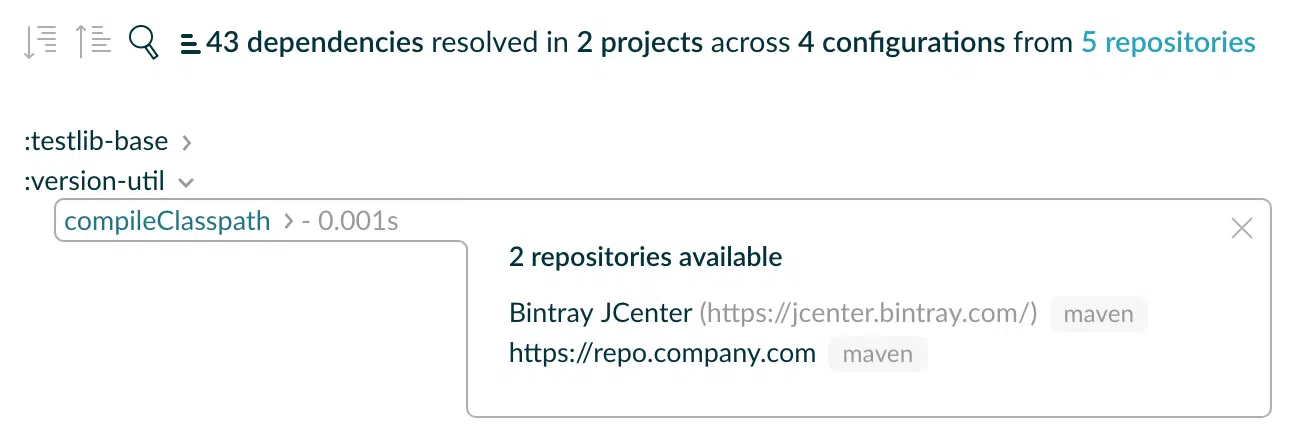
Most builds resolve dependencies from repositories which, until now, have not been represented in build scans. You can now see all the repositories used within a build and identify which repository a particular dependency was resolved from, which is extremely useful when analyzing resolution results when utilizing multiple repositories.
Build scans now itemize all usages of deprecated Gradle functionality. While Gradle logs details about such usages to the console, this may not be noticed and can be hard to deal with if your build produces a lot of output. Build scans list the deprecated usages in a more effective format, making it easier to migrate away from the deprecated functionality.
Read on for the details of these and other new features and improvements.
Use version 1.16 of the build scan plugin and version 5.0 of the remote build cache node for optimal usage of Gradle Enterprise.
Highlights
Identify source of slow configuration lifecycle callbacks
Gradle allows plugins and scripts to register callbacks for important lifecycle events during configuration, such as when a project has been evaluated, when all projects have been evaluated, when the task graph has been calculated and so forth. The “Configuration” section of the “Performance” page of build scans now reports how long each registered callback took and attributes it to the script or plugin that registered it.
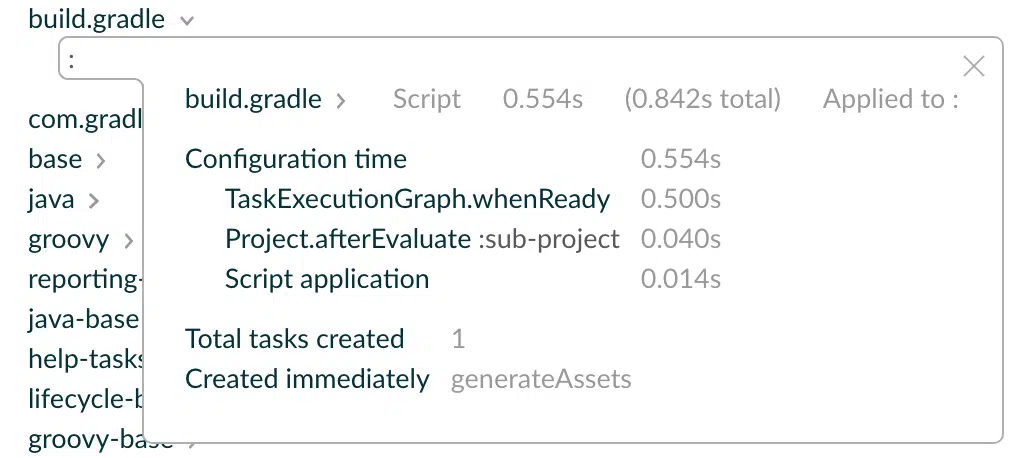
This provides a more complete profile of the configuration time impact of a script or plugin and makes it easier to find bottlenecks at configuration time that occur during lifecycle callbacks.
Profile and explore script and plugin dependencies
Gradle scripts and plugins may themselves apply other scripts and plugins. When assessing the configuration time impact of a particular script or plugin, it is often necessary to consider the impact of the scripts and plugins that it applies.
The “Configuration” section of the “Performance” page provides a trace in the inspector of each script and plugin. It shows the scripts and plugins that lead to it being applied and the scripts and plugins that it itself applied.
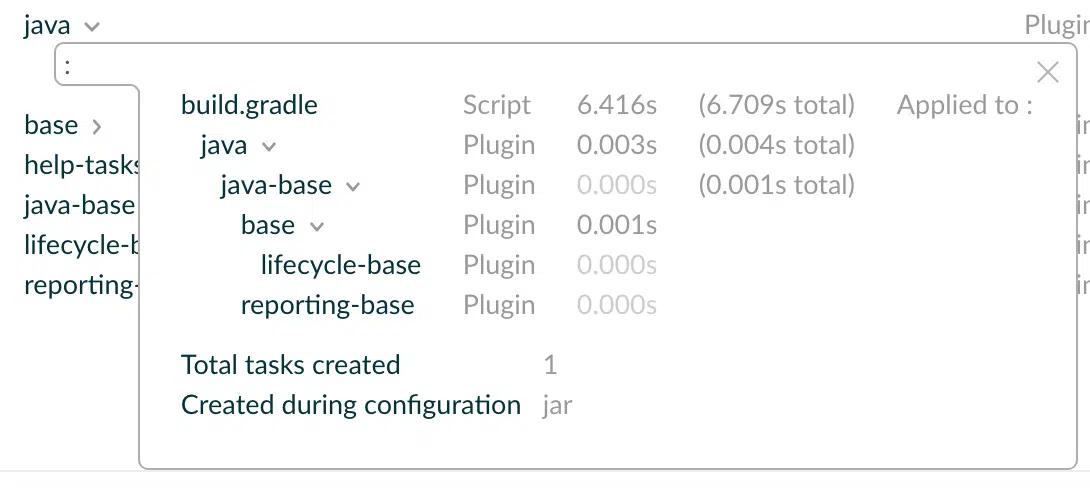
The first time listed indicates the “own time” for the script or plugin, while the “total time” (in parentheses) includes the time for its applied scripts and plugins.
This can be used to optimize configuration time, and, particularly for complex builds, to discover unnecessary or undesirable dependency relationships between scripts and plugins.
Determine time spent compiling build scripts
Gradle build scripts must be compiled before they can be used and the time this takes contributes to the build’s configuration time. The amount of time taken, and which scripts needed to be compiled, is now detailed in the “Configuration” section of the “Performance” page of build scans.

Compilation time itself can rarely be significantly optimized, but knowing how much of the configuration time was due to compilation (whether a little or a lot) is essential for reasoning about configuration time performance generally.
Furthermore, Gradle caches compiled builds scripts and recompiles when necessary, such as when the script has changed or its classpath has changed. If your builds are constantly having to recompile many scripts, this may indicate a potential optimization by increasing the cacheability by avoiding dynamic build script dependencies, reducing the amount of changes in buildSrc projects, or ensuring a persistent Gradle user home directory (where build scripts are cached to) from build to build.
Inspect dependency repositories used to obtain dependencies
Build scans now detail the repositories used to obtain dependencies, and indicate which repository a particular dependency was obtained from. This information is available when the dependencies have previously been downloaded and are now being used from Gradle’s local cache, and also when they are downloaded for the first time.
These insights can be used to optimize builds by removing unnecessary or unwanted repositories, and is also particularly useful when debugging unexpected resolution results involving multiple repositories and dynamic dependencies.
The list of repositories is available within the “Dependencies” section, by clicking the repository count. The details of each repository are listed, along with the configurations that used the repository and the dependencies that it provided.
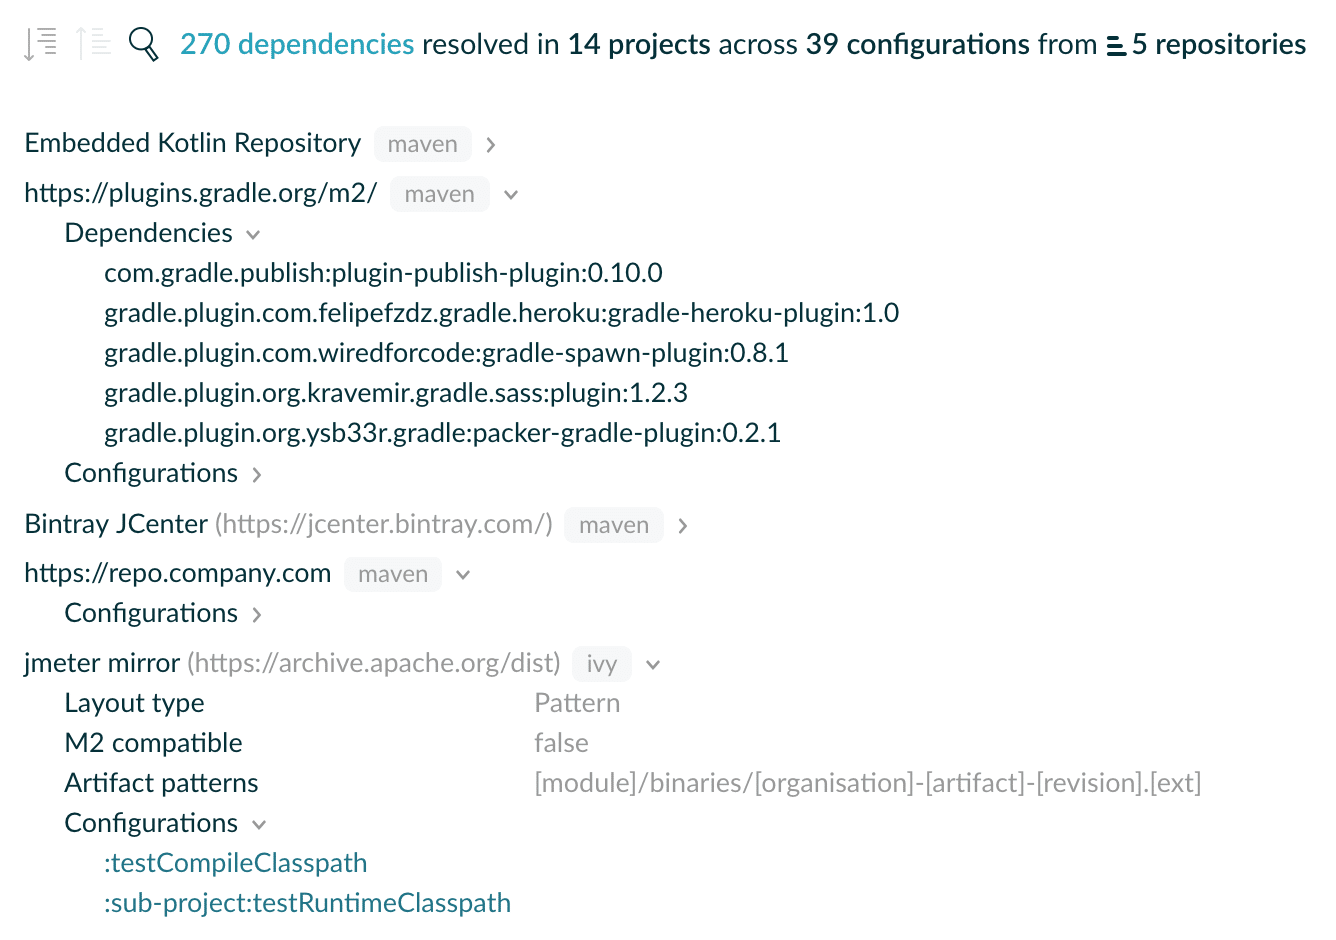
From the existing dependency graph view of the “Dependencies” section, the repository that a particular dependency was obtained from is available via the “Repository” tab on the inspector for the given dependency.

From the same view, the list of repositories used to resolve a configuration can be investigated by viewing its inspector.
Identify usages of deprecated Gradle functionality
As Gradle evolves, aspects of its API and functionality that are problematic are removed after a period of deprecation. Build scans now detail any usages of deprecated functionality, making it easier to assess, prioritize, and fix the usages.
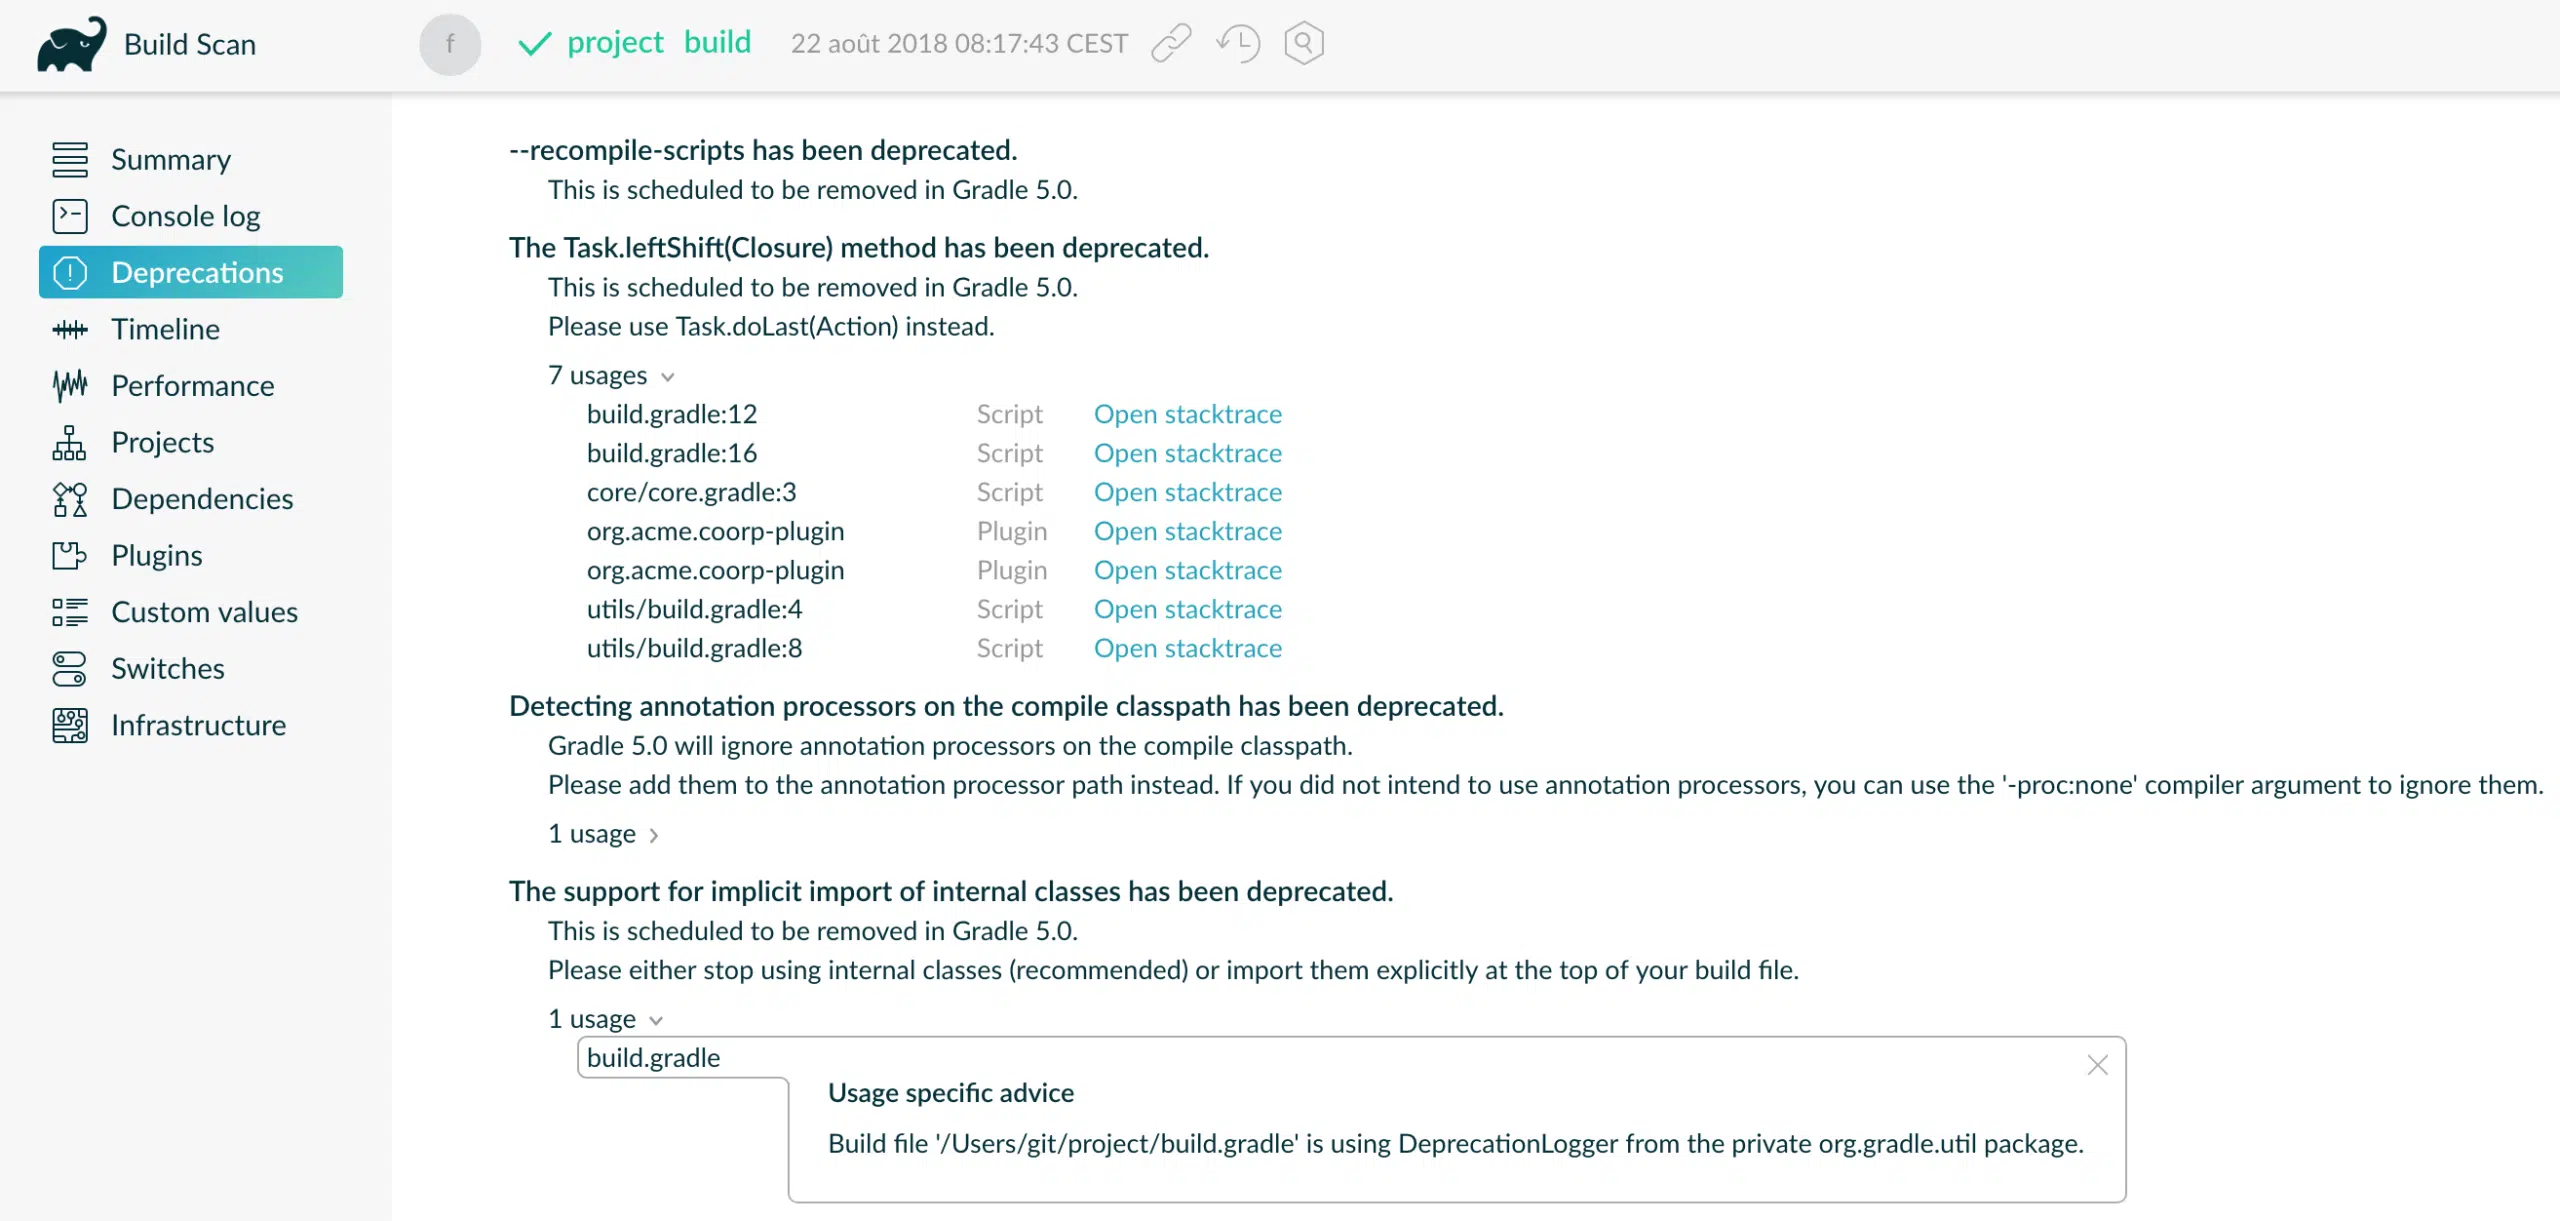
If your build uses deprecated functionality, it is unlikely to work with the next major Gradle version. With Gradle 5.0 just around the corner, now is a good time to deal with any usages of deprecated functionality in your builds.
View and download console log as plain text
Build scans provide the console output from the build in a rich and shareable format. New in this release is the ability to view the console output as raw plain text and to download it. This is particularly useful for builds with a lot of console output, where the browser can take a long time to render all of the output.


For builds with a few tens of thousands of lines, viewing the raw text will be much faster than waiting for the browser to render the default version. For builds with more lines than that, it is generally best to go straight to downloading and viewing locally as some browsers can still take a long time to render that much plain text.
Identify source of included builds
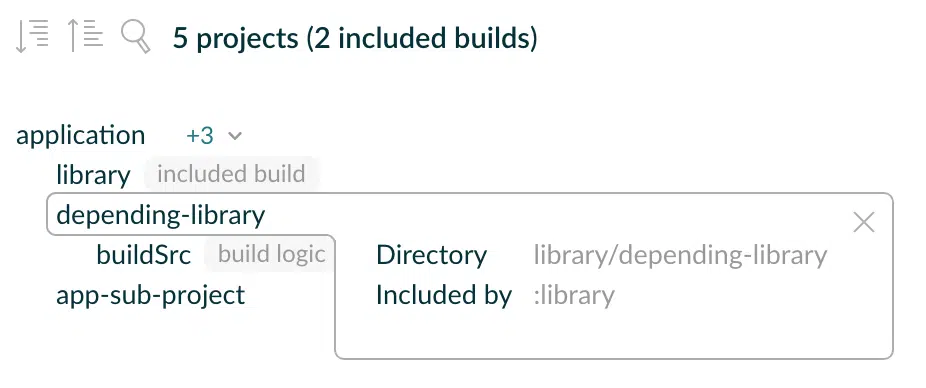
Gradle 4.10 adds the ability for included builds within a composite build to themselves include other builds, i.e. composite builds of composite builds. Included builds always use a “top level” path prefix for their tasks and other elements, regardless of which build included them, e.g. task :includedBuild:foo is always :includedBuild:foo. This ensures that references to the build do not change depending on the context. However, this can make it non obvious that a build was included by another included build.
The “Projects” page of build scans now indicates which build included any included builds that make up the project tree, via the inspector of a given project.
Inspect and delete individual build cache entries
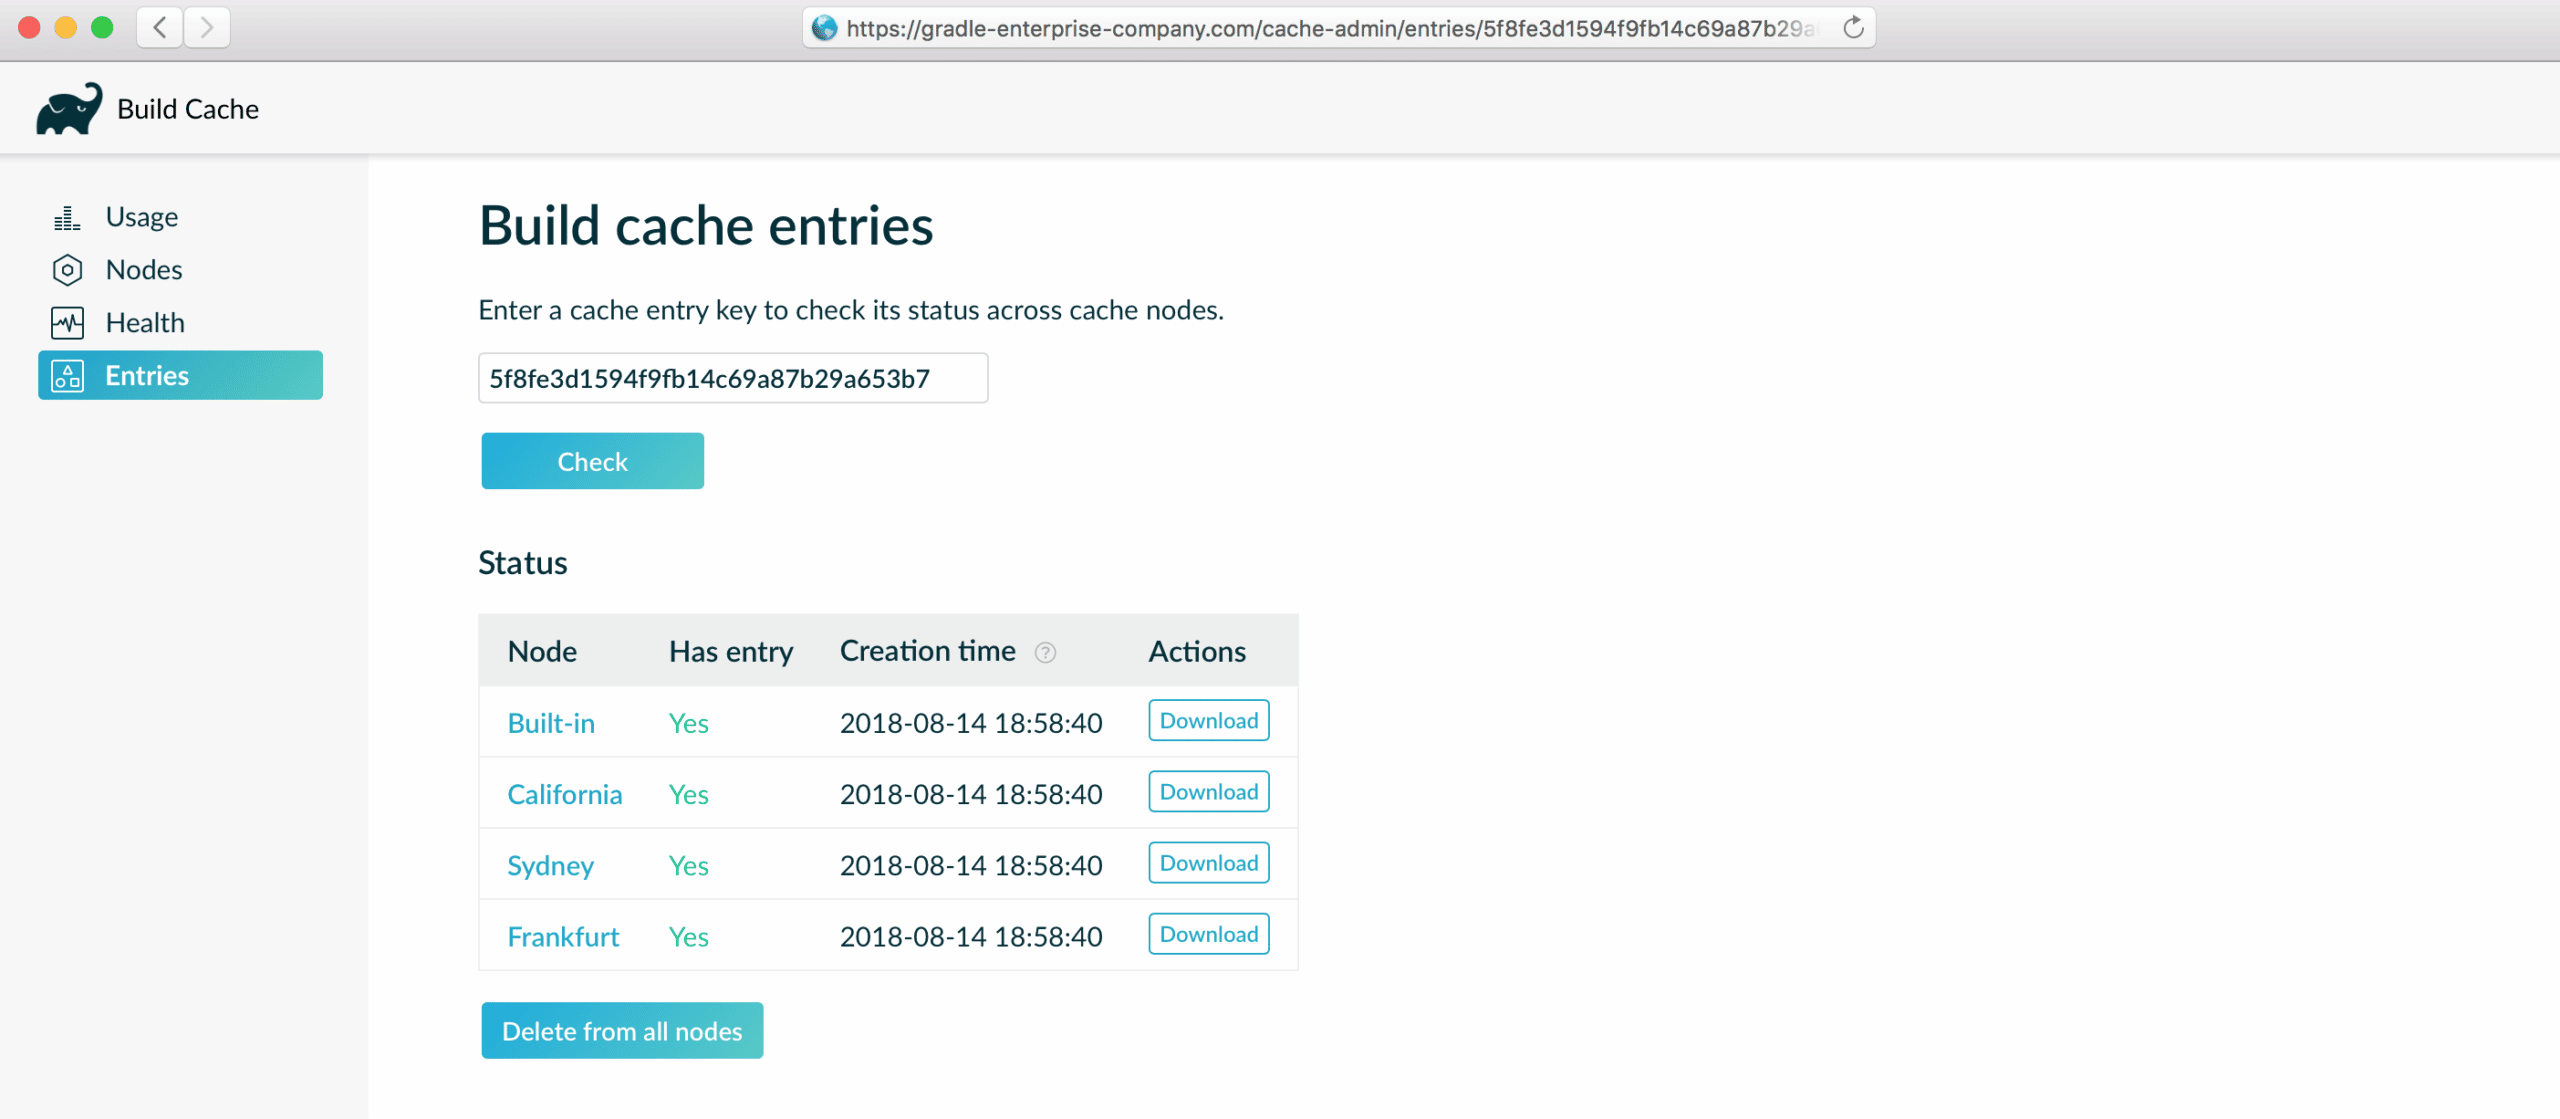
The Gradle build cache works by generating a checksum for a task’s inputs as a key, and obtaining previously generated outputs for those same inputs if available. Incorrectly implemented or configured Gradle tasks may upload entries to the build cache that are undesirable. Generally, fixing the implementation or configuration results in a different cache key being calculated and new entries being used subsequently. In rare circumstances, fixing the root problem does not cause a new cache key to be used and it is desirable to remove the existing entry from the cache.
The build cache administration section of Gradle Enterprise now provides an “Entries“ page for determining whether any cache nodes have an entry for a particular key, to download and inspect the entry, and delete it if required.
Upgrade notes
Changes
- [FEATURE] Accepts build scans published with build scan plugin 2.0
- [FIX] Dependency page crashes when visualizing an unresolved dependency
- [FIX] Dependency page sometimes crashes when clicking a project dependency
- [FIX] Artifact repositories with no URL property are not handled
- [FIX] Links in deprecation advices cannot be clicked
- [FIX] Long deprecation advices take too much horizontal space
- [FIX] Scan list query is not submitted when pressing 'Enter' in some browsers
- [FIX] 'Upload' / 'Download' performance dashboard help texts are interchanged
- [FIX] Deprecation details are not loading when using build scripts applied by URI
- [FIX] Deprecation usage script display name is not always normalized correctly
- [FIX] Deprecation usage script display name should contain line number for Kotlin based build scripts
- [FIX] Dependency view is not loading when searching dependency by name in big graphs
- [FIX] Test output has extra newlines sometimes
- [FIX] Hovering a code unit application row does not expand to full width
- [FIX] Zooming quickly on the timeline breaks the application in Safari
- [FIX] Task hover element on the timeline is wrongly positioned
- [FIX] Long values in scan list form controls are rendered improperly
- [FIX] Space savings introduced in 2017.6 do not complete correctly when data retention is enabled
- [FIX] Daily maintenance time ignores user-set time
- [FEATURE] Identify source of slow configuration lifecycle callbacks
- [FEATURE] Profile configuration time of scripts and plugins including their script and plugin dependencies
- [FEATURE] Determine time spent compiling build scripts
- [FEATURE] Inspect dependency repositories used to obtain dependencies
- [FEATURE] Identify usages of deprecated Gradle functionality
- [FEATURE] View and download console log as plain text
- [FEATURE] Identify source of included builds
- [FEATURE] Inspect and delete individual build cache entries
- [FIX] Very long custom values extend the width of the page too far
- [FIX] Performance dashboard does not work for Gradle 2.9 builds
- [FIX] Disk usage may not respect the configured scan retention period

