Join the only event dedicated to Developer Productivity Engineering. Learn more
Practice continuous learning & improvement with
Trends & Insights
With the relentless growth in the number of developers, code bases, and repositories most organizations declare victory if their build and test metrics stay flat over time since some level of regression is often the norm. It is difficult to get ahead of the problems because most organizations are stuck in reactive mode-troubleshooting the most recent critical bug that is blocking development or mitigating the most impactful flaky test or performance regression. Nothing is learned from these incidents and little data is collected that would be helpful in resolving similar failures down the road because developers are consumed putting out fires.
While Develocity provides solutions for these relatively tactical daily failures, it also provides a platform to respond proactively to systemic problems and longer-term performance regressions. It does this by providing Trends & Insightsthat make key metrics and KPIs more observable and actionable.
Benefits of Continuous Learning and Improvement
Trends & Insights enable development teams to take a proactive posture by providing performance and reliability baselines and observability of anomalies. Since you can’t improve what you are not measuring, Trends & Insights provide a foundation for building an always-learning and continuous-improvement culture.
Trend & Insights solution components include Build & Test Failure Trends for Local and CI Builds, Build & Test Performance Trends for Local and CI Builds and REST API

Build & Test Failure Trends for Local and CI Builds
Develocity can chart trends of build and test stability broadly (e.g. across your entire organization) or very precisely (e.g. an exact error message for a single project, build agent, and git branch). Should a problem ever reoccur, historical data will quickly show you the timeline and failure patterns to dramatically speed up resolution time.
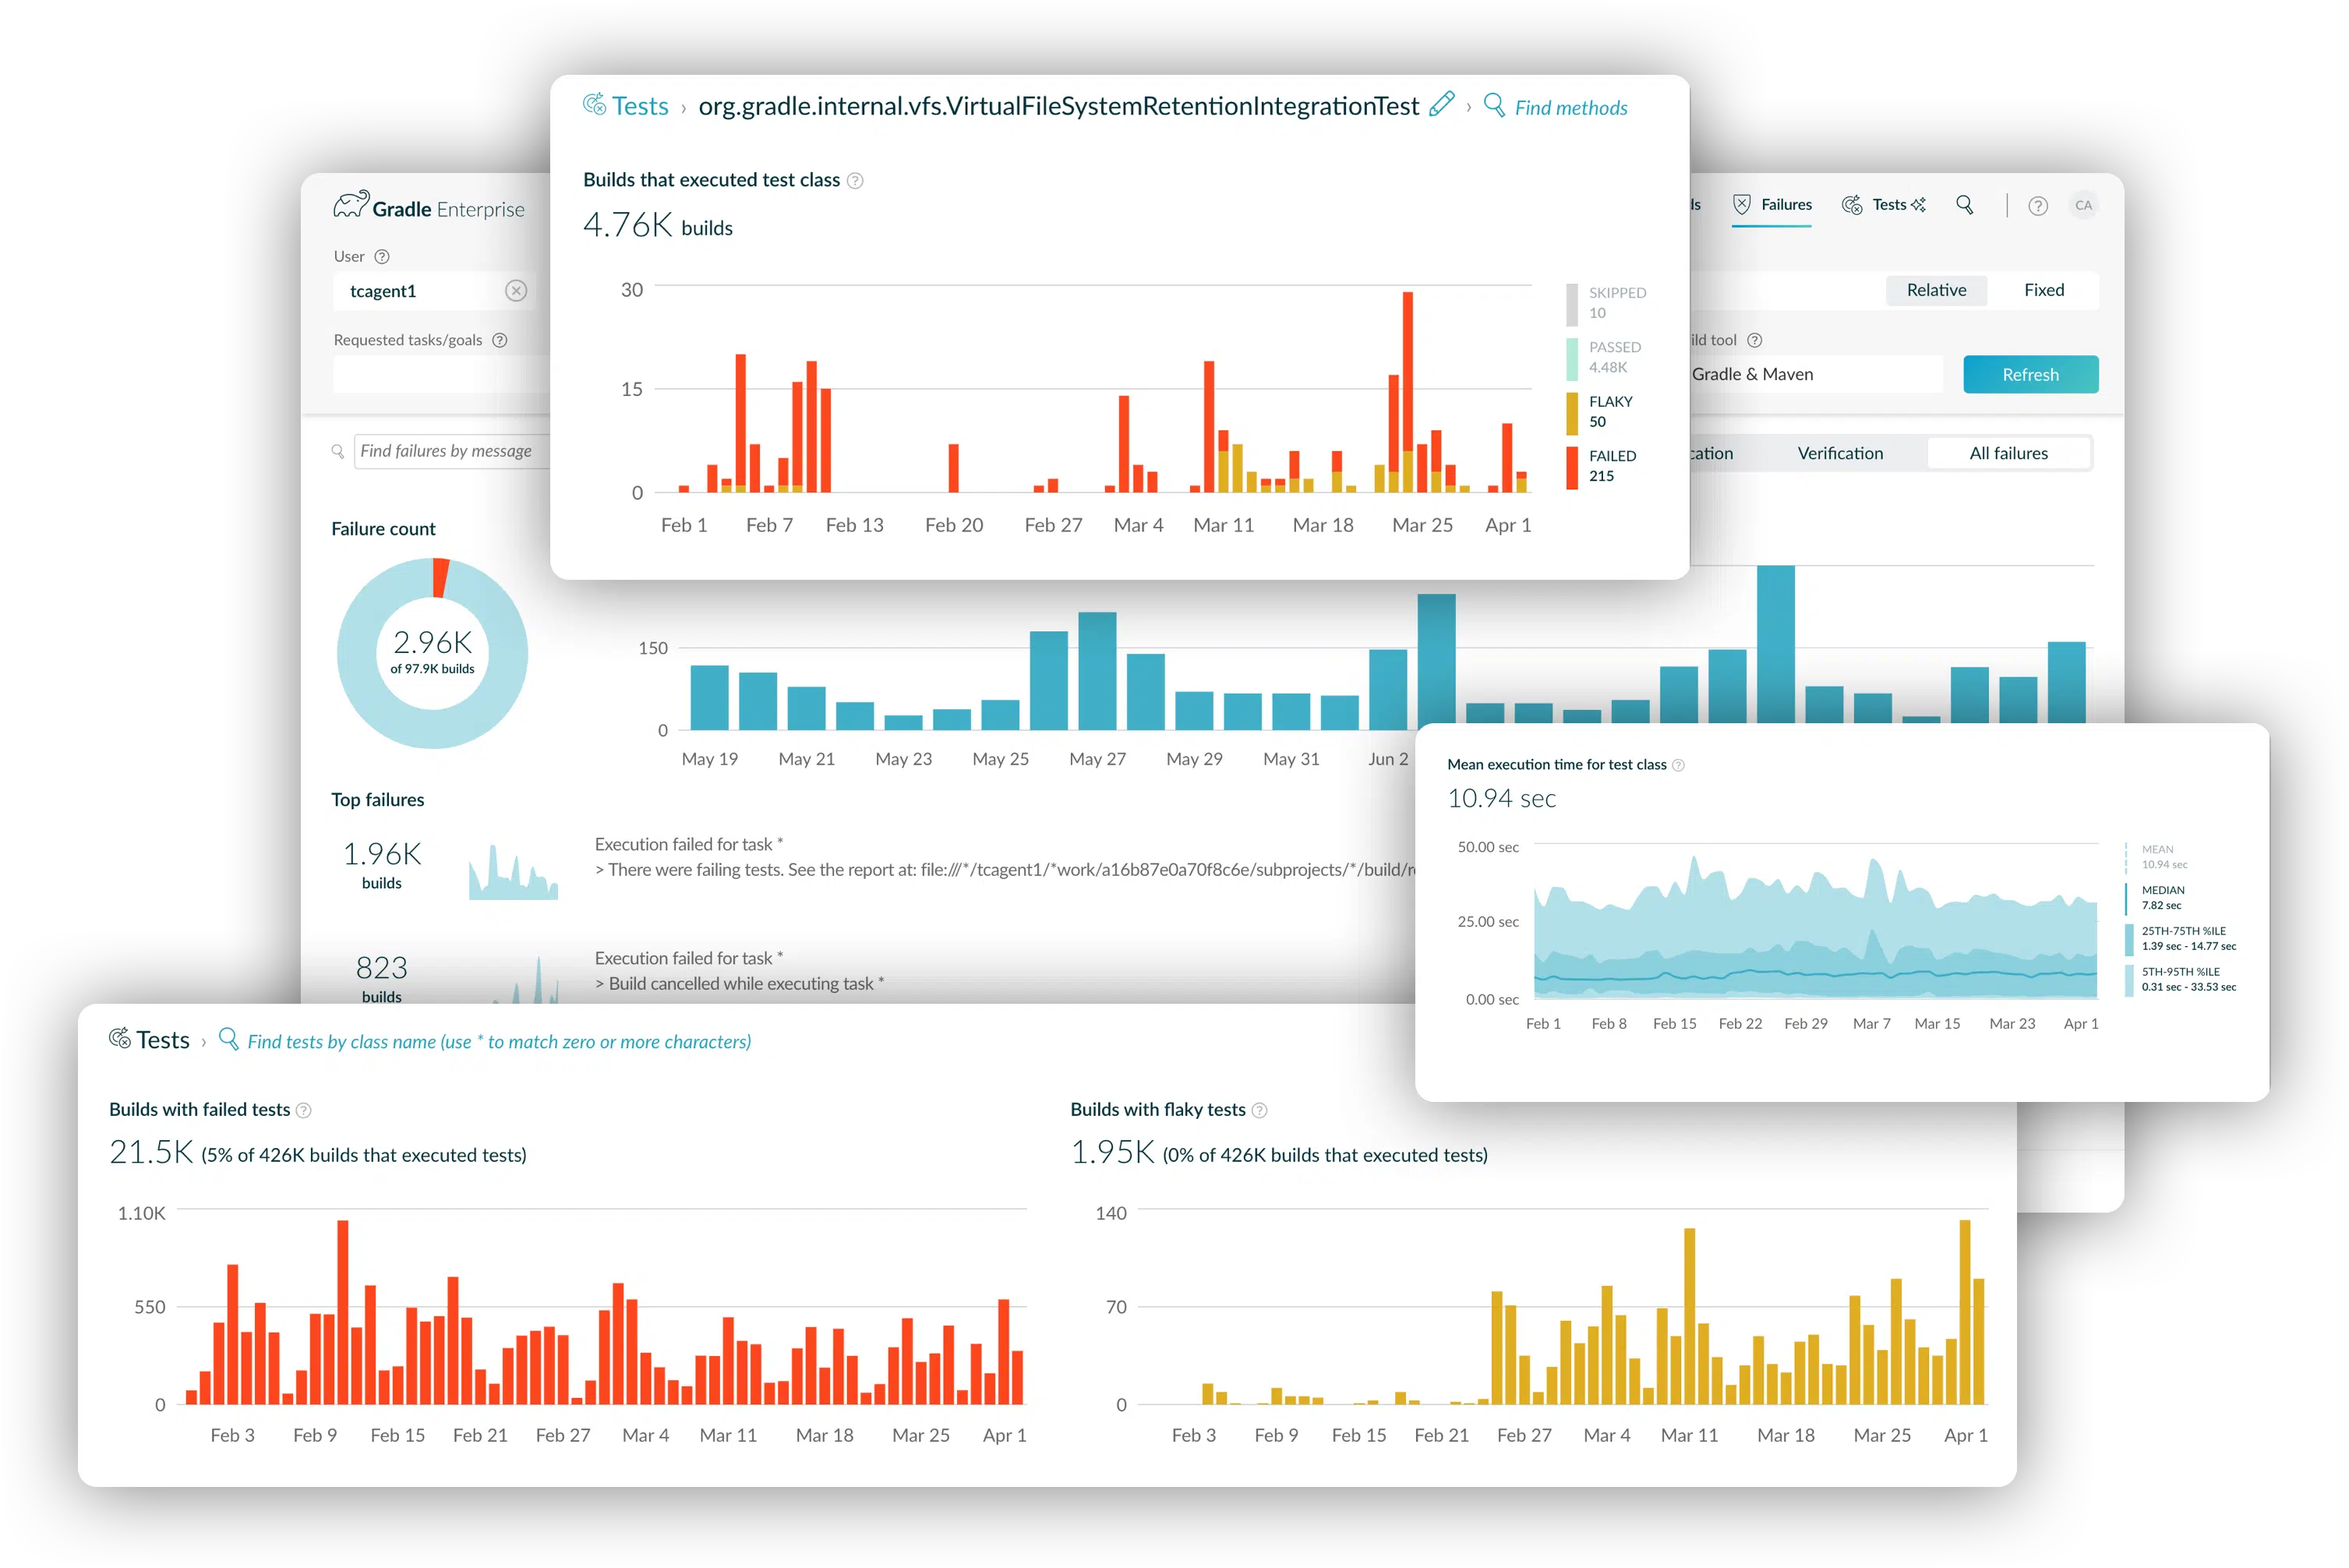
Build and test reliability trends tell you when things break so you can proactively and quickly fix problems.
Build & Test Performance Trends for Local and CI Builds
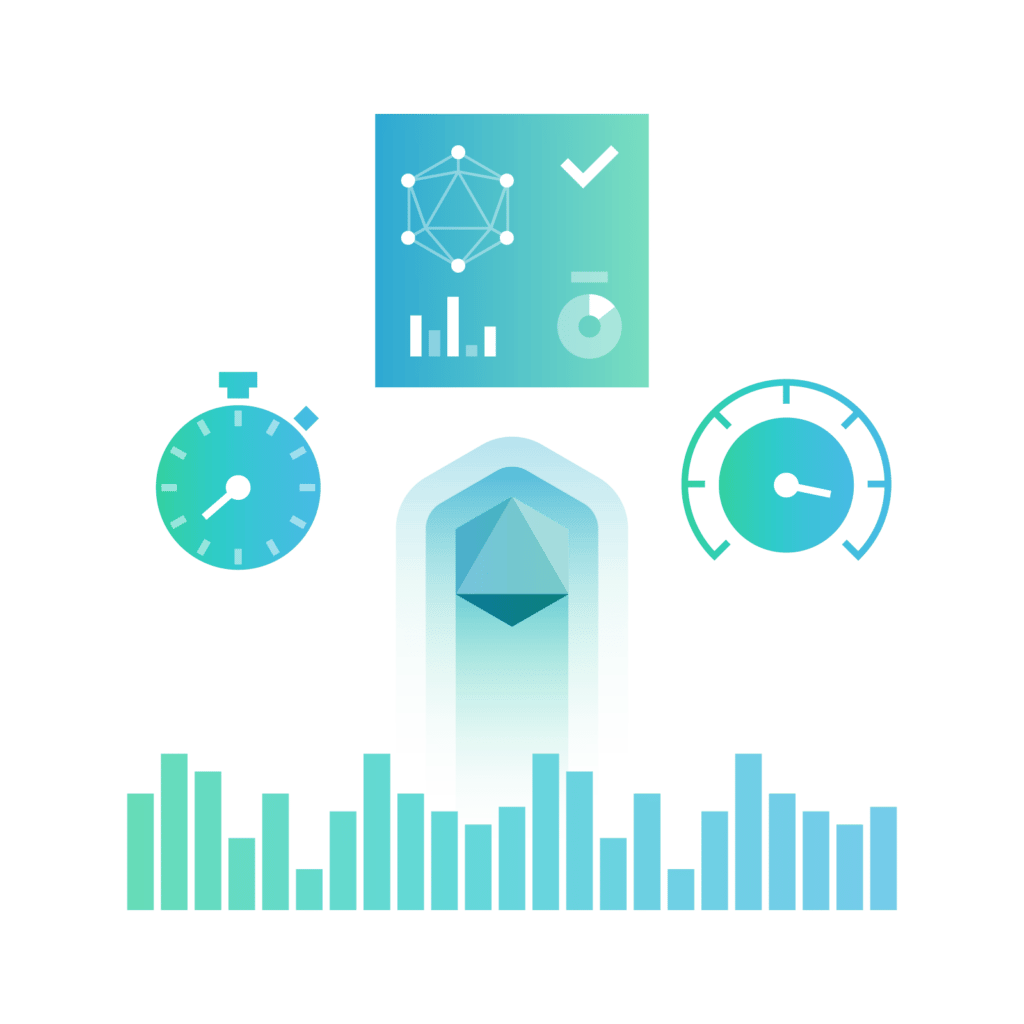
The Build & Test Performance Trends dashboard generates and provides intuitive visualizations of several key performance metrics. For the first time you can get quick access to some fundamental data points, such as:
Number of builds executed over a specified time period and aggregated build execution time
Serial execution time (for assessing the strength of your parallelism implementation)
Savings from the cache and cache overhead
Dependency download time
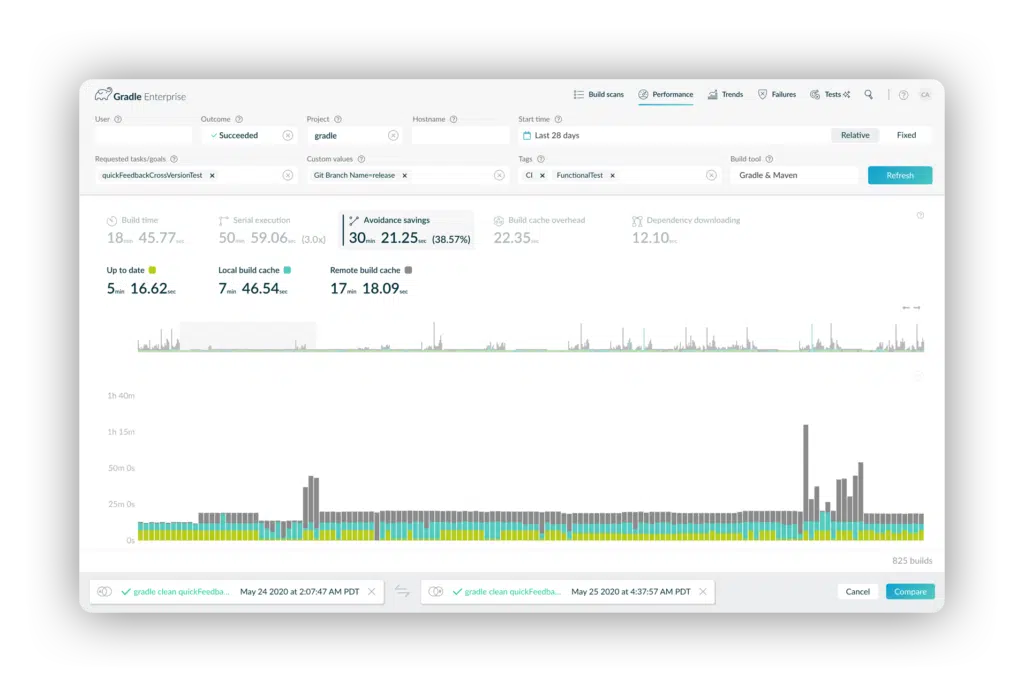
The performance dashboard allows you to identify slow builds then compare them to healthy ones in order to avoid unnecessary developer waiting.
All of this can be filtered for arbitrary subsets of builds. For example, you can filter by specific user, specific projects, CI builds, CI builds from a specific branch, CI builds of a particular type, Local builds with changes not yet committed to version control and many other criteria.
With ready access to these metrics, you can easily derive additional metrics and KPIs of interest like the total developer wait time for local or pull request builds to complete and associated aggregate costs. You can also compare metrics between different locations and different hardware configurations.
In practical terms, it’s easy to quantify the value of wasted R&D investment due to unnecessarily slow builds or the value of shaving one minute off the average build time in terms of engineering years or additional R&D budget. For even a moderate-sized project these numbers are often eye popping. This feature set is further augmented by the performance profiling capabilities provided by the Develocity Performance Continuity solution.
You can also see the performance trend for every test class and every test method or test method subset. And you can filter by the same powerful criteria to find, for example, differences between locations or hardware configurations.
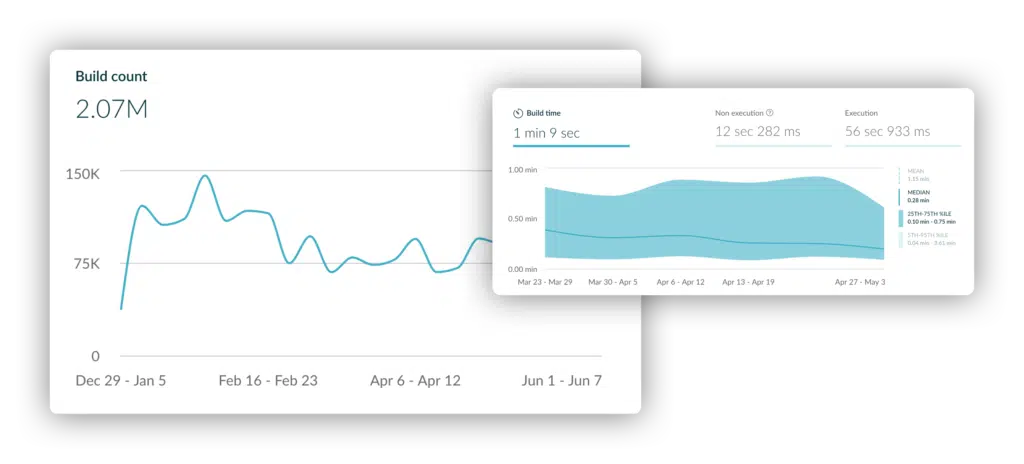
Modern software teams run millions of builds per month. Small improvements add up to massive productivity gains.
Here is a real world example of the impact of an always learning continuous improvement culture at Elastic. The Develocity Build & Test Performance Trends dashboard revealed an anomalous regression in execution time for test classes starting around January 13. This launched an investigation and the remediation was in place by January 28. You can see that the new baseline not only validated the fix, but demonstrated that the impact of the fix was to improve the performance compared to the original baseline.
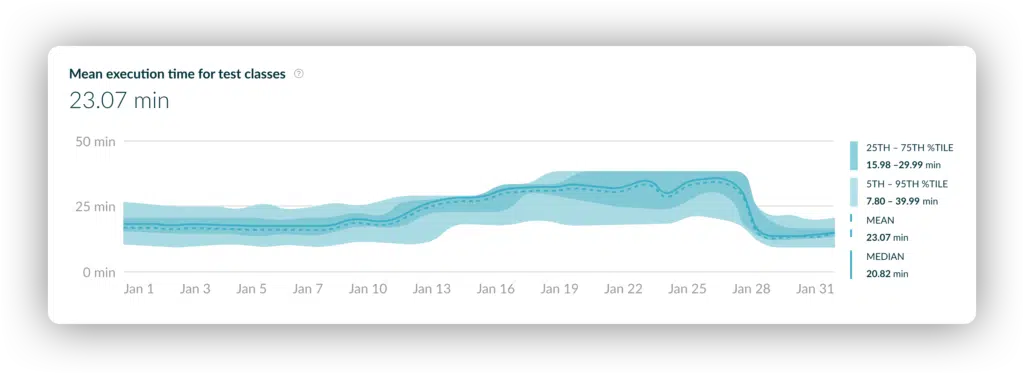
It is easy to detect and track anomalous performance regressions and visualize their resolution.
REST API for Build Trend Data
Our REST API is a new foundation for interacting with Develocity. It is defined using the OpenAPI specification and comes with sample code for data models and client applications. The new API delivers metric, KPI and other Develocity data for easy integration with BI/reporting tools and monitoring systems. For example, some companies use Tableau as their system of record to consolidate data for reporting; with the new API, you can include Develocity data in your dashboards. You can also use the API to analyze data from multiple builds beyond the features built in to Develocity.


