Ideas & Insights
In Santa Clara County, CA there are currently
11,000 job openings for build engineers listed on
ZipRecruiter. The median annual base salary is
$129,000. Why are build engineers in high demand?

Well, many development leaders are realizing that
build engineers are critical to unblocking
developers and unlocking productivity gains. In
fact, simple math demonstrates that an investment
in a build engineer dedicated to introducing and
overseeing Developer Productivity Engineering
practices can be recovered in a matter of months.
One such practice is implementing build and test
acceleration technologies like
Build Caching
and
Distributed Testing
which typically make build times 2X to 10X faster.
Suppose you could shave 5 minutes off your average
10 minute local build time, and each developer ran
10 builds a day and waited an equal amount of time
for CI builds to complete. In one year, the
average wait time cost per engineer would be
around $12,000 if each developer cost $1 minute
and 50% of that wait time is unproductive.
With a modest team of 20 developers, your
breakeven point for a typical Silicon Valley build
engineer would be less than six months, without
even considering the value of other DPE benefits.
These include dramatically reduced Mean Time to
Resolution for software incidents; better
management of flaky tests and other avoidable
failures; and more efficient CI resource
consumption. Of course, your mileage may vary, but
you can use our
online calculator
to easily estimate the value of productivity gains
you could achieve in your own environment by
investing in a DPE initiative.

Expert Takes
The key to effective troubleshooting is not to
rely on our assumptions about what is happening,
but rather have an actual snapshot of what
happened, says Hans Dockter, Gradle CEO.
We were working with a company whose build
engineering experts insisted that when they
tried out our build acceleration technology
(Build Cache), build and test time had increased
5X. And they assured us they were running the
before and after builds the exact same way. We
convinced them to run and compare the two builds
using Build Scans (which is our data collection
and reporting technology). An examination of the
data revealed that the “before” Maven build was
run with 128 threads while the “after” build
using our technology was run with only one
thread due to a misconfiguration of the
directory hierarchy.
The lesson we learned together is that when it
comes to toolchain support we rely way too much on
what we think or hypothesize. We think we have
assigned a certain amount of memory. We think we
have assigned a certain number of processes. But,
even us experts are often mistaken. Fact-based,
data-driven software development organizations run
their builds and tests faster, more efficiently,
and avoid many costly mistakes based on false
recollections and assumptions. Tools are available
that collect and organize the relevant data for
you. Take advantage of them.
Get more expert takes and learn more best
practices from the definitive guide to Developer
Productivity Engineering.

New Technology
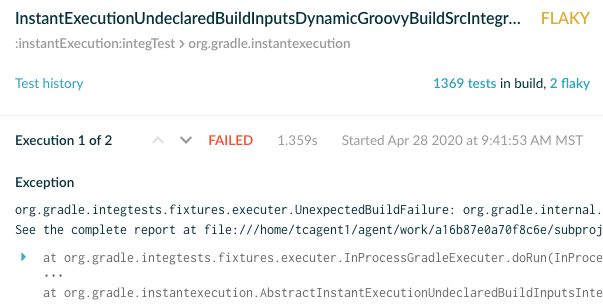
Just like failing tests, flaky tests indicate that
something might be wrong with the user-facing
behavior of your product. It is important to track
and fix them as soon as possible. Gradle
Enterprise 2020.2 features test analysis
improvements that streamline test debugging and
root cause identification. They include:
-
A redesigned test result view that provides
quick access to relevant contextual information
such as recent test history, and other
failed/flaky tests from the same build
-
Colocation of all executions of a single test to
make output and exception comparisons simpler
-
Stacktrace analysis that shows only stackframes
relevant to the current context

In a recent Blog post, Eric Wendelin, Analytics
Lead Engineer, explores each of these improvements
in detail with a blow-by-blow account of how he
leveraged these new capabilities to debug a nasty
flaky test in Gradle’s own build

Success Stories
While an Android developer at SoundCloud, Nelson
Osacky was one the leaders of SoundCloud’s
Developer Productivity Engineering initiative and
a member of the team conducting experiments on the
impact of build cache and other DPE practices as
part of their Gradle Enterprise trial. Nelson
discusses the results of the trial experience in a
recent webcast entitled “The Gradle Enterprise
Proof-of-Value Trial Experience.”
In the Webcast, Nelson describes some of the pain
points the SoundCloud team encountered in their
Android build environment—including slow feedback
cycles and inefficient root cause analysis. He
also related some of the benefits he experienced
as a result of the trial, such as learning how to
be a developer productivity engineer and using
data to “solve [developer productivity] puzzles”.
Last summer Nelson wrote a two-part Blog series
for SoundCloud on dealing with
“Gradle Remote Build Cache Misses”
in their Android build environment. He has become
so passionate about helping other companies
address their developer productivity engineering
challenges, that he has become a frequent speaker
and evangelist for the movement.

Featured Upcoming Event
On June 18, Droidcon will host and Gradle will
present a webcast entitled: “Not Just Another
Modularization Talk: Scaling Your Android Build
with Gradle .” The premise of the talk is that
Android build speeds can get out of hand pretty
quickly once you start piling on the build
flavors. And while Gradle Plugins and
modularization help a lot with bringing build
times down, the question remains, what if
anything, else can be done? The will answer that
question and will specifically cover:
-
Expert tips and tricks on scaling your Android
build
-
Best Practices to ensure a productive
development environment
-
Developer Productivity Engineering technologies
that can be used to accelerate local and CI
builds
-
Collaborative debugging and optimization using
build scans
-
Measuring your Android scaling initiative
success
|
