Writing tests is hard. Fixing them is harder. Join the webinar.
Gradle Enterprise 2018.2
The new build performance dashboard visualizes build performance over time, by aggregating and charting build time, task parallelization, incremental build and build cache effectiveness. It provides new insights for powering decision making and driving build optimization.
Two new build cache features increase the benefit and ease of operating a distributed build cache network: preemptive replication makes builds faster, while health monitoring makes it easier to ensure your build cache network is functioning optimally.
Build scans now provide the console logging for individual tasks. When inspecting build failures due to tasks, the task’s console logging is easily accessible making debugging faster.
Read on for the details of these and other new features and improvements.
Use version 1.13.1 of the build scan plugin and version 4.1 of the remote build cache node for optimal usage of Gradle Enterprise.
Highlights
Inspect build performance over time with the performance dashboard
Build scans have long provided detailed performance information for individual builds. Now, you can easily comprehend key aspects of build performance across many builds.
The new performance dashboard is an interactive and multidimensional graph that analyzes builds matching search criteria.
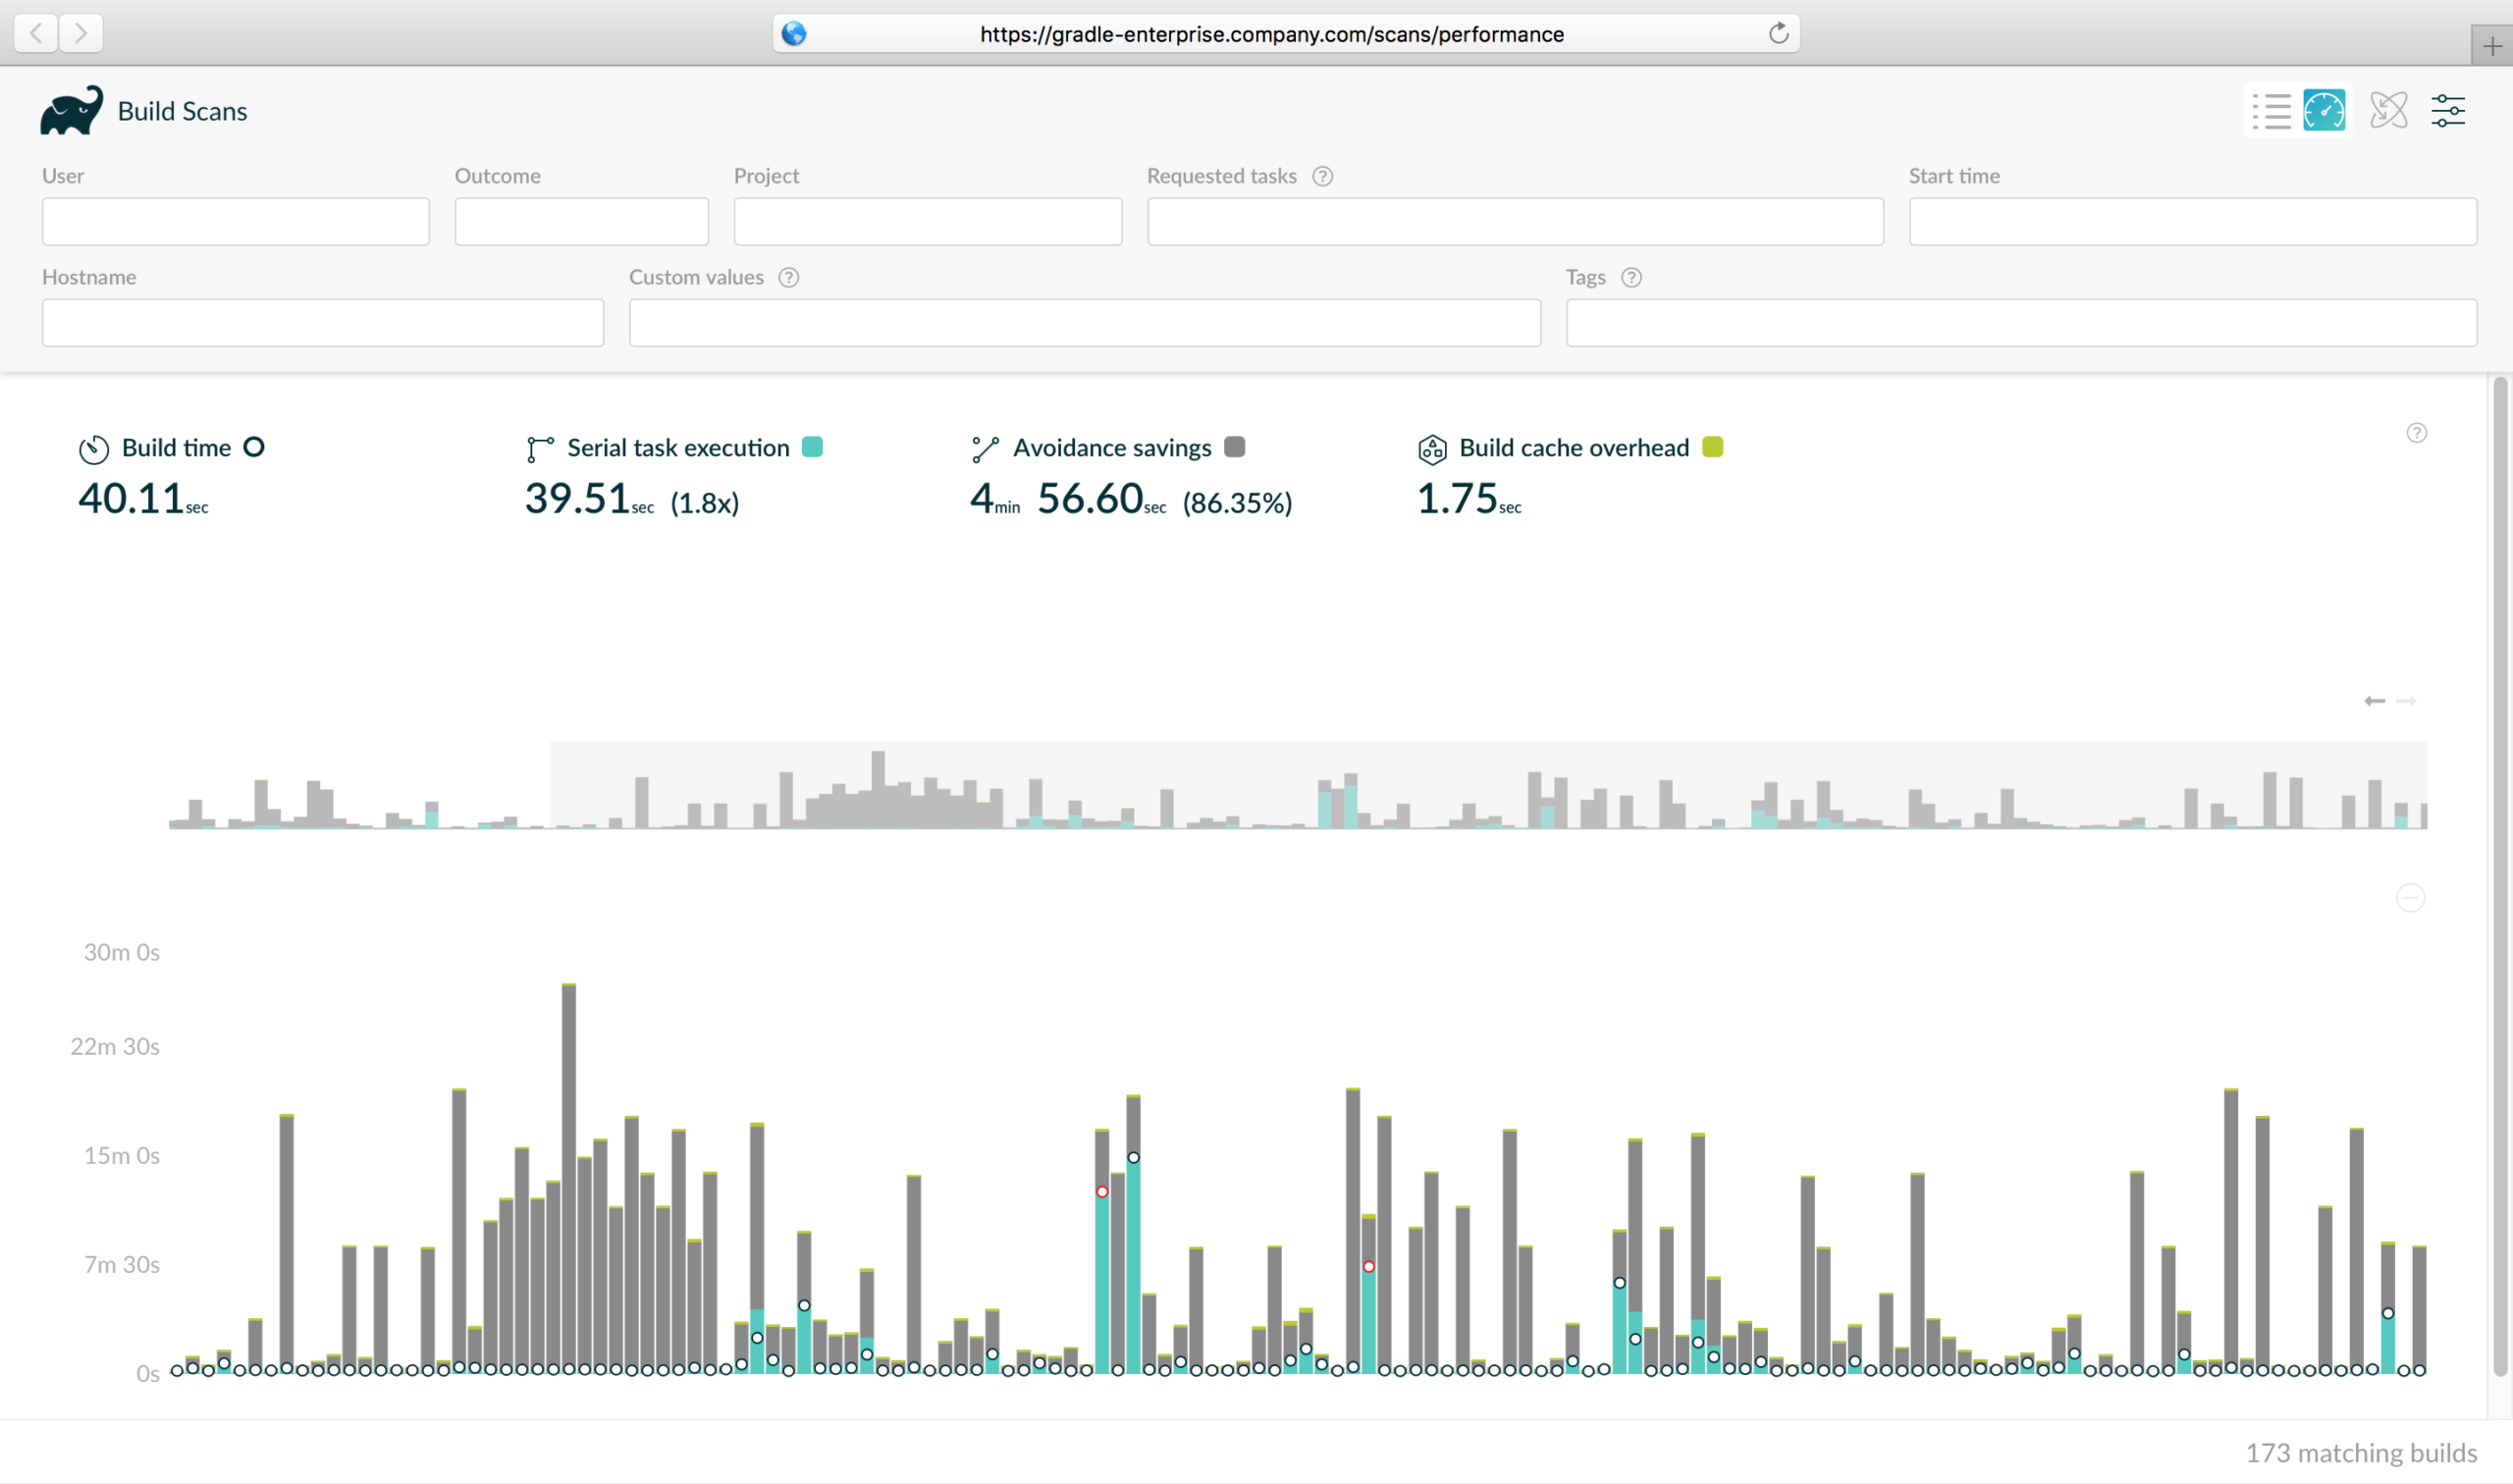
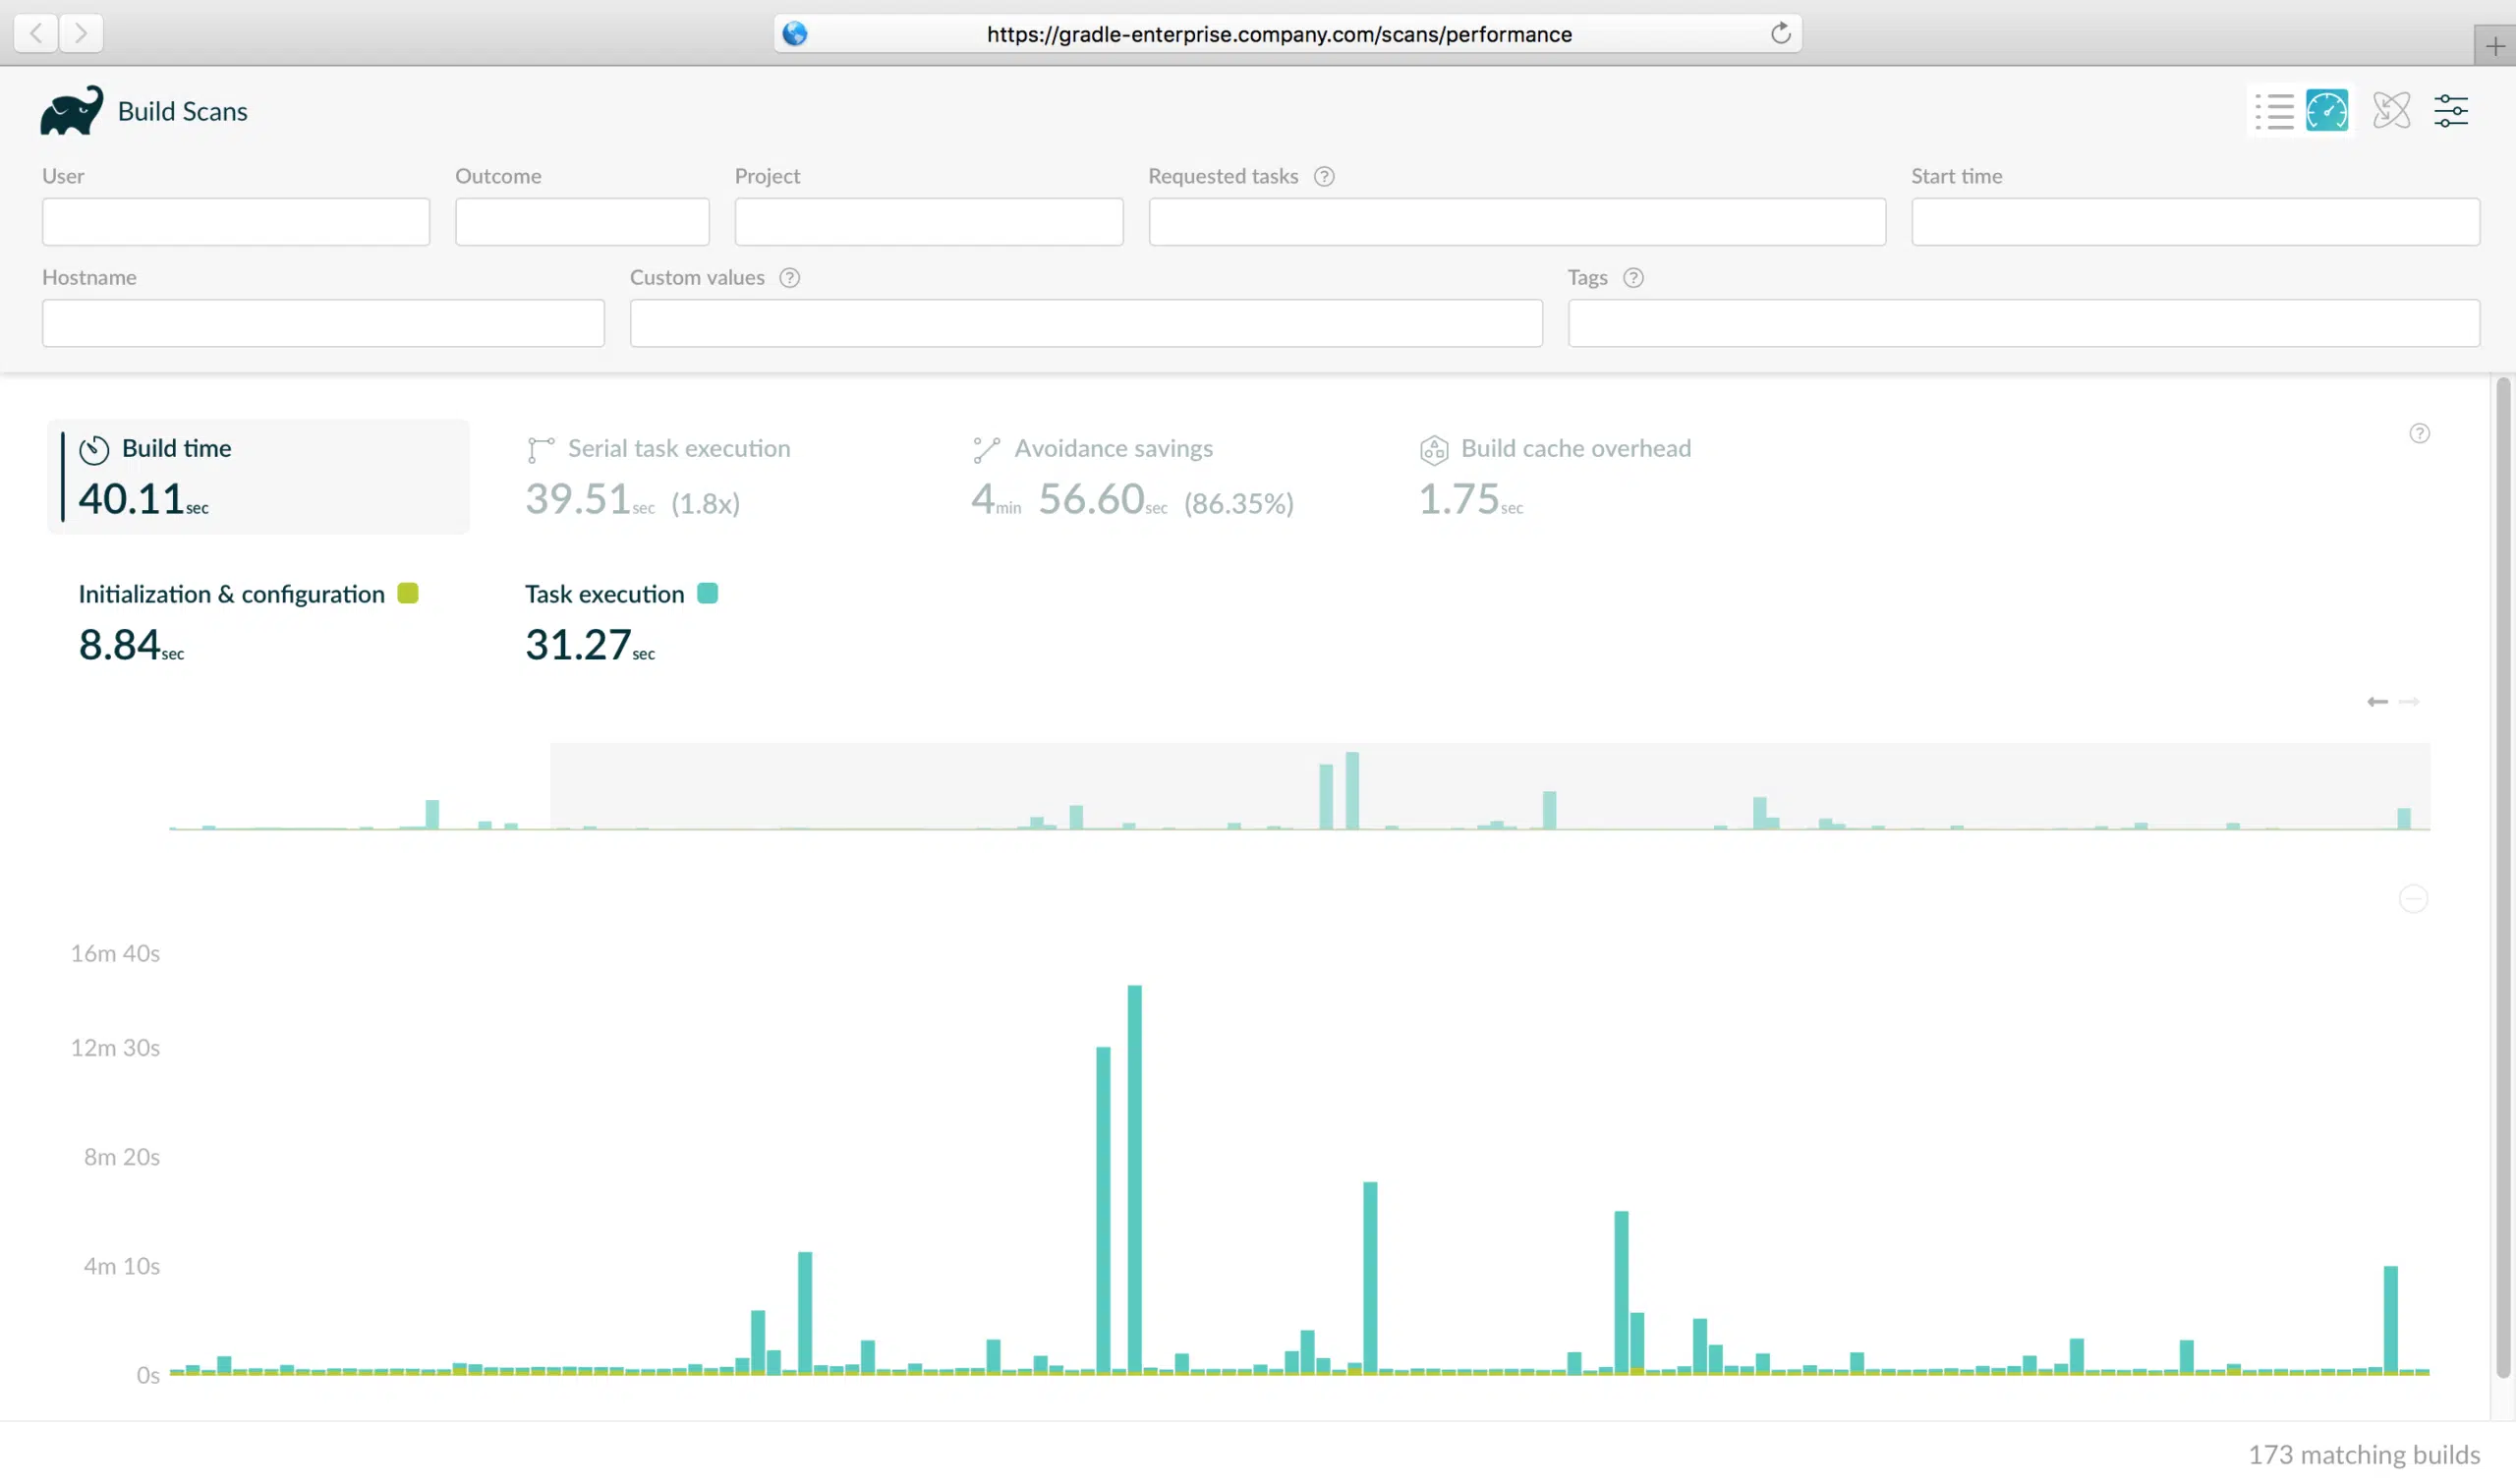
The default view charts build time, serial task execution time (the sum of the durations of each task),avoidance savings (how much time was saved by incremental build and build cache), and build cache overhead (e.g. cache entry download time). Clicking on a metric focuses it, breaking it down into its constituent parts. For example, focusing on build time breaks it down between initialization & configuration and task execution.
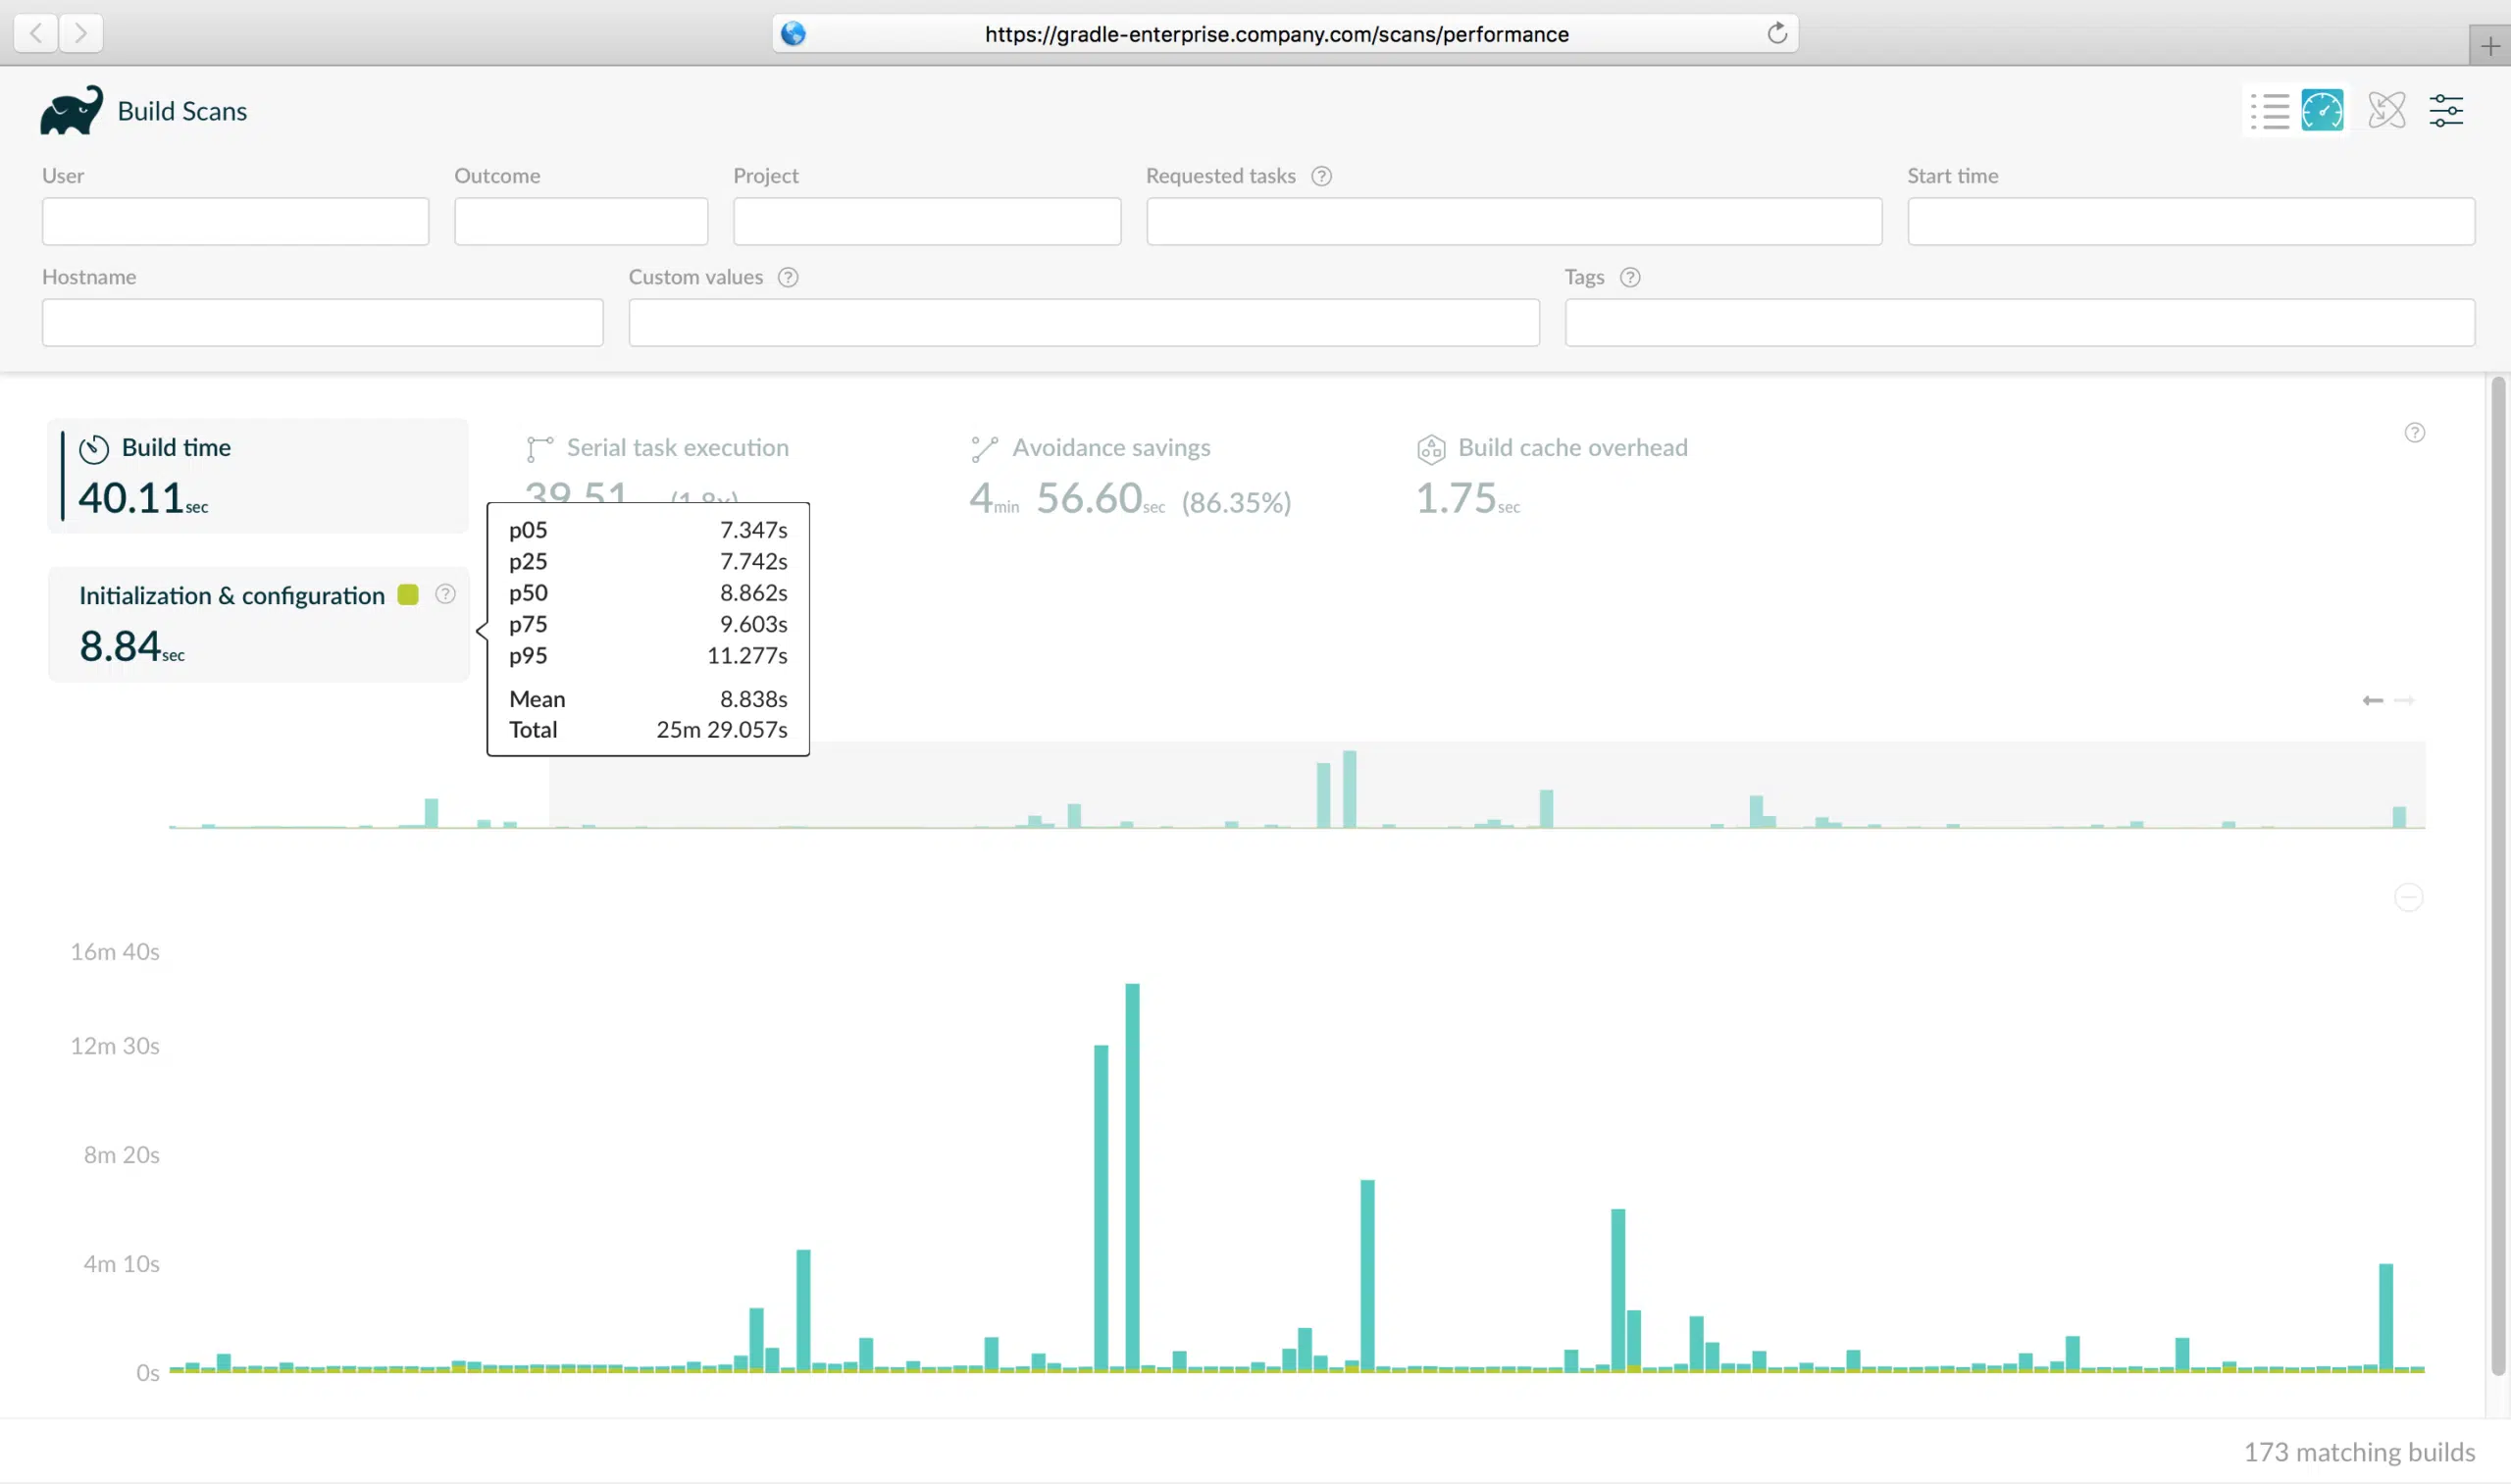
The mean value for each metric is given, along with key percentile values.
Each bar in the graph represents a build. Clicking on an entry presents the relevant details of that build, and allows navigating through to the corresponding build scan for more detail or nominating the build to be used in a build comparison.
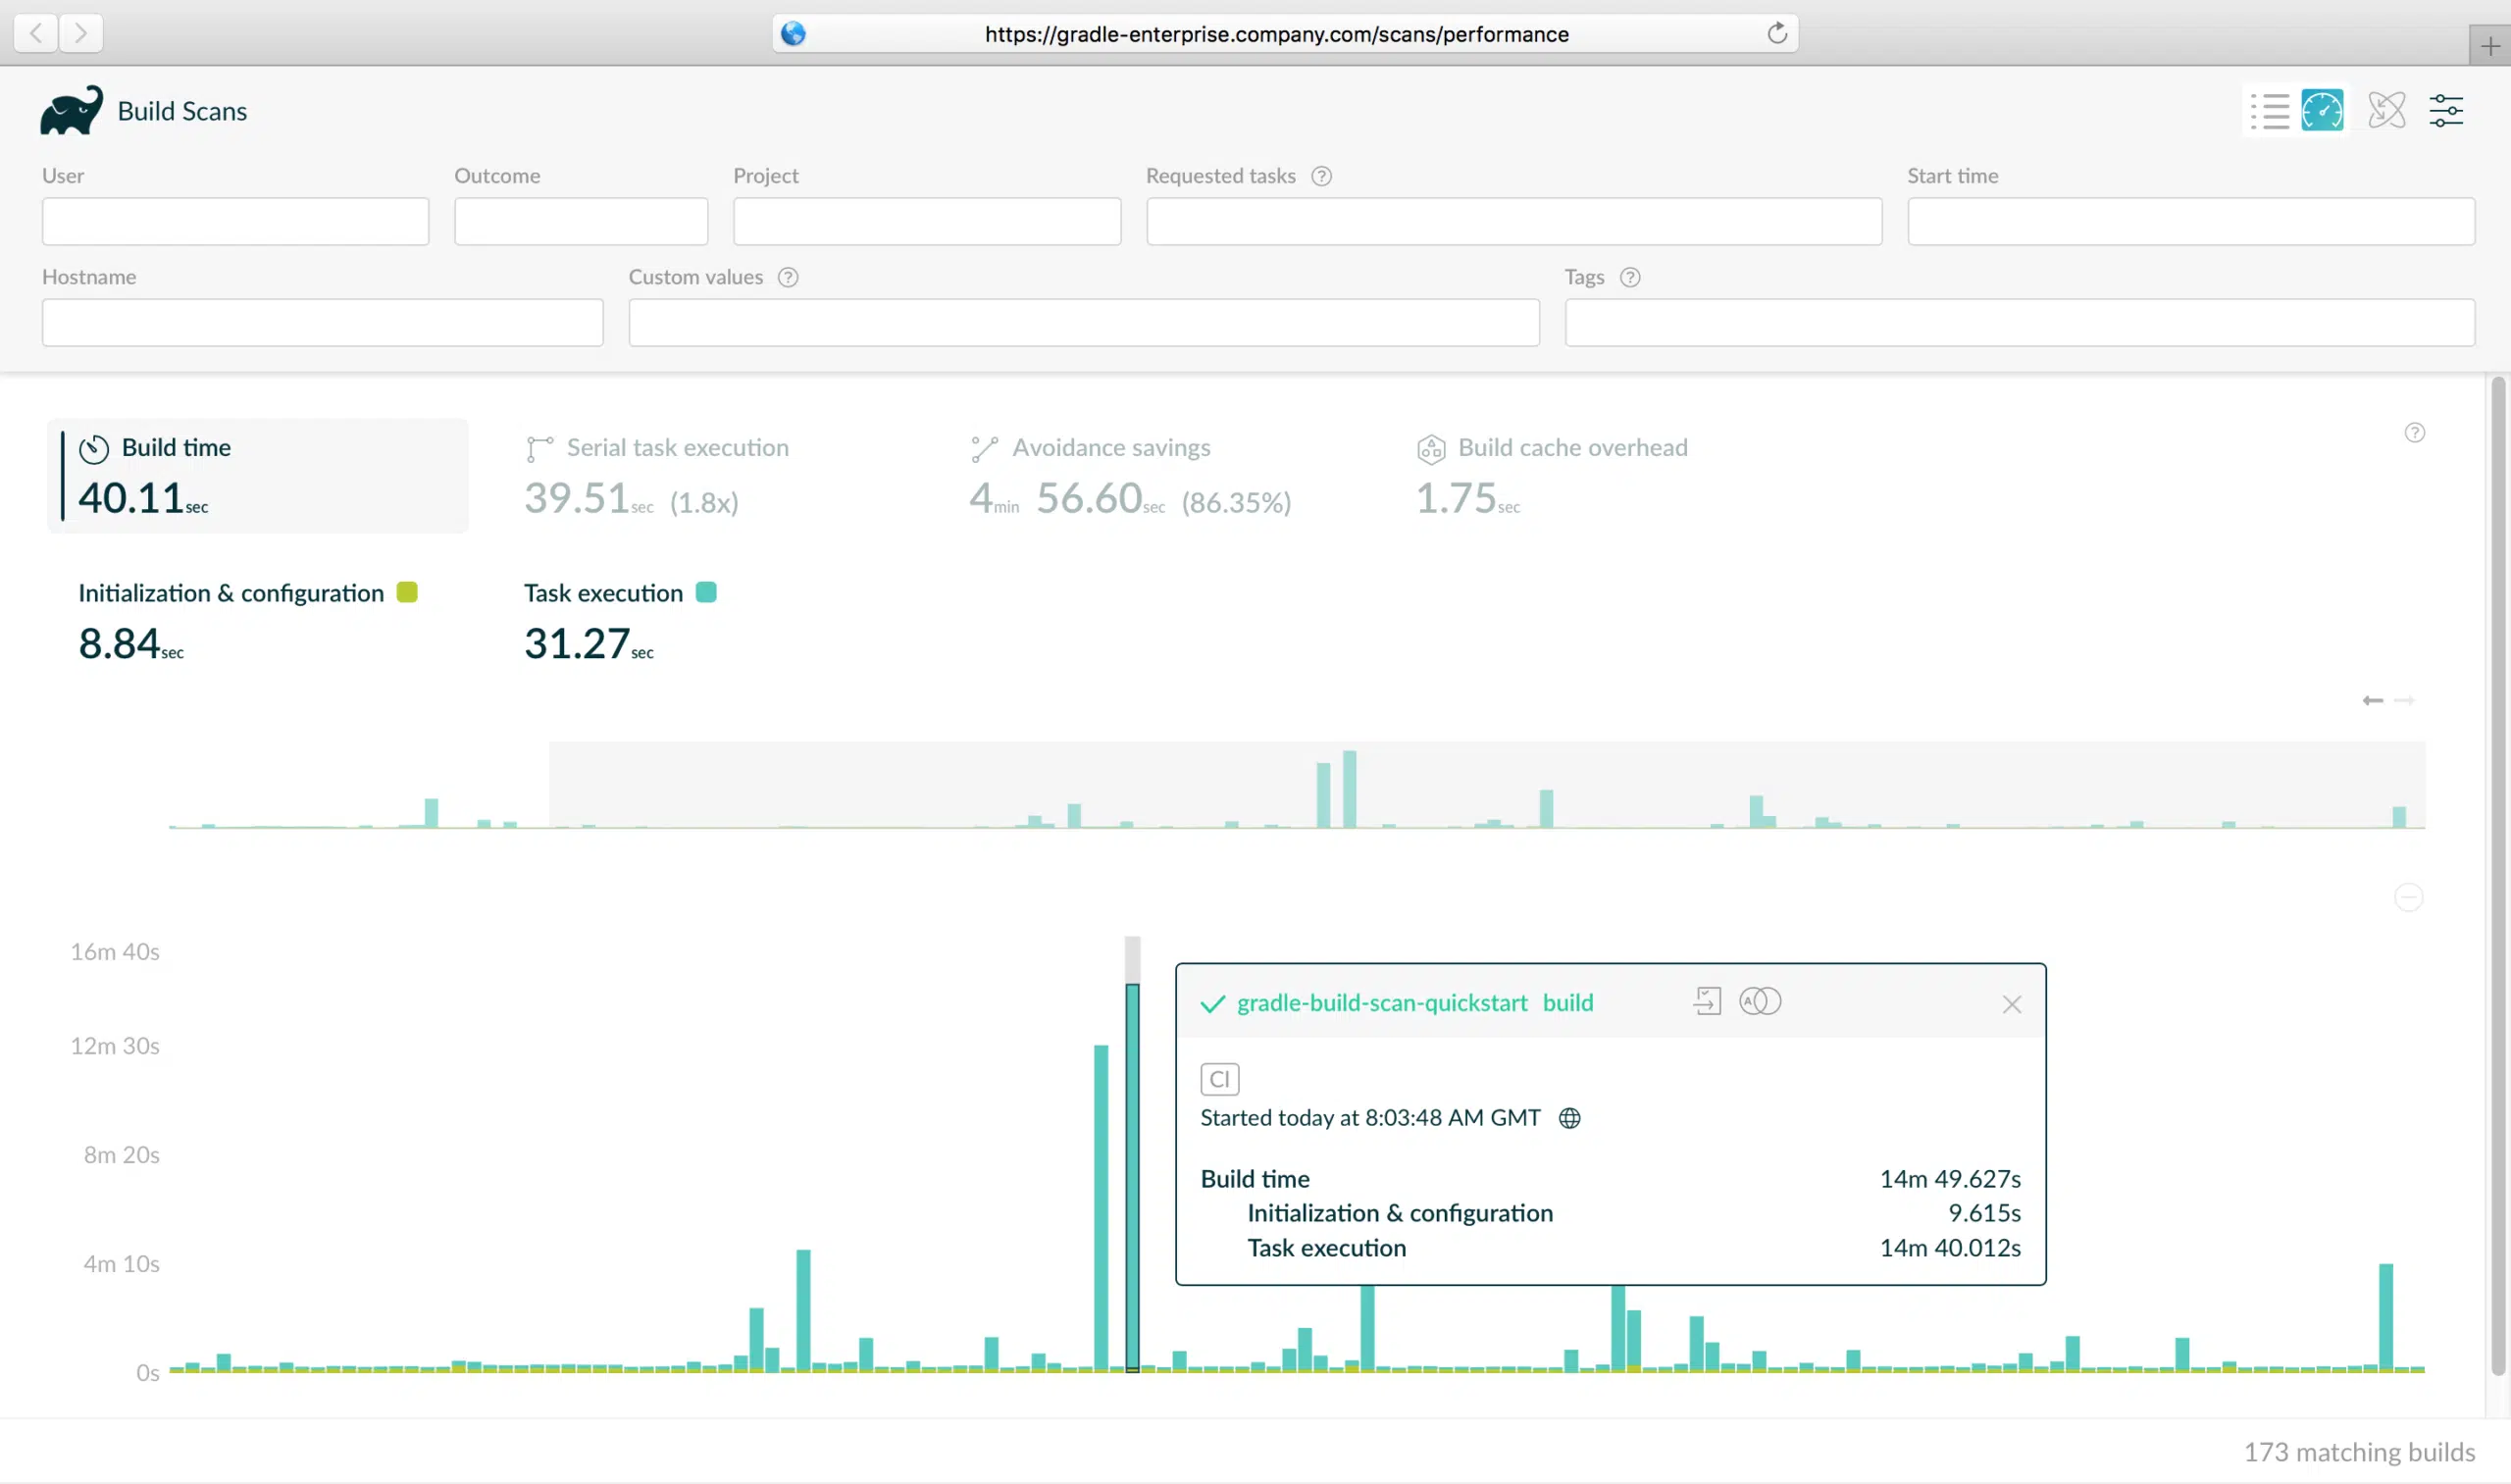
There are many potentially interesting data sets to analyze. For example, all builds by a certain user of a certain project over the last week (how many builds did they run? how long were their builds? was their remote build cache connection fast?). Or, all builds of a certain CI plan (has build time increased or decreased? how often are we getting good build cache hits? how much time is it saving? is build time dominated by tasks that are not cacheable that we should make cacheable?).
The power of the performance dashboard is amplified when your build scans are enriched with tags and custom values, as these can be used as search criteria. For example, by tagging builds of a certain CI plan with a well known tag, you can easily analyze the performance of these builds in isolation.
Access the performance dashboard by using the view selector at the top right of the scan list page.

Faster build cache hits when using replication
Preemptive replication enables better build cache performance, at the expense of more network transfer between nodes.
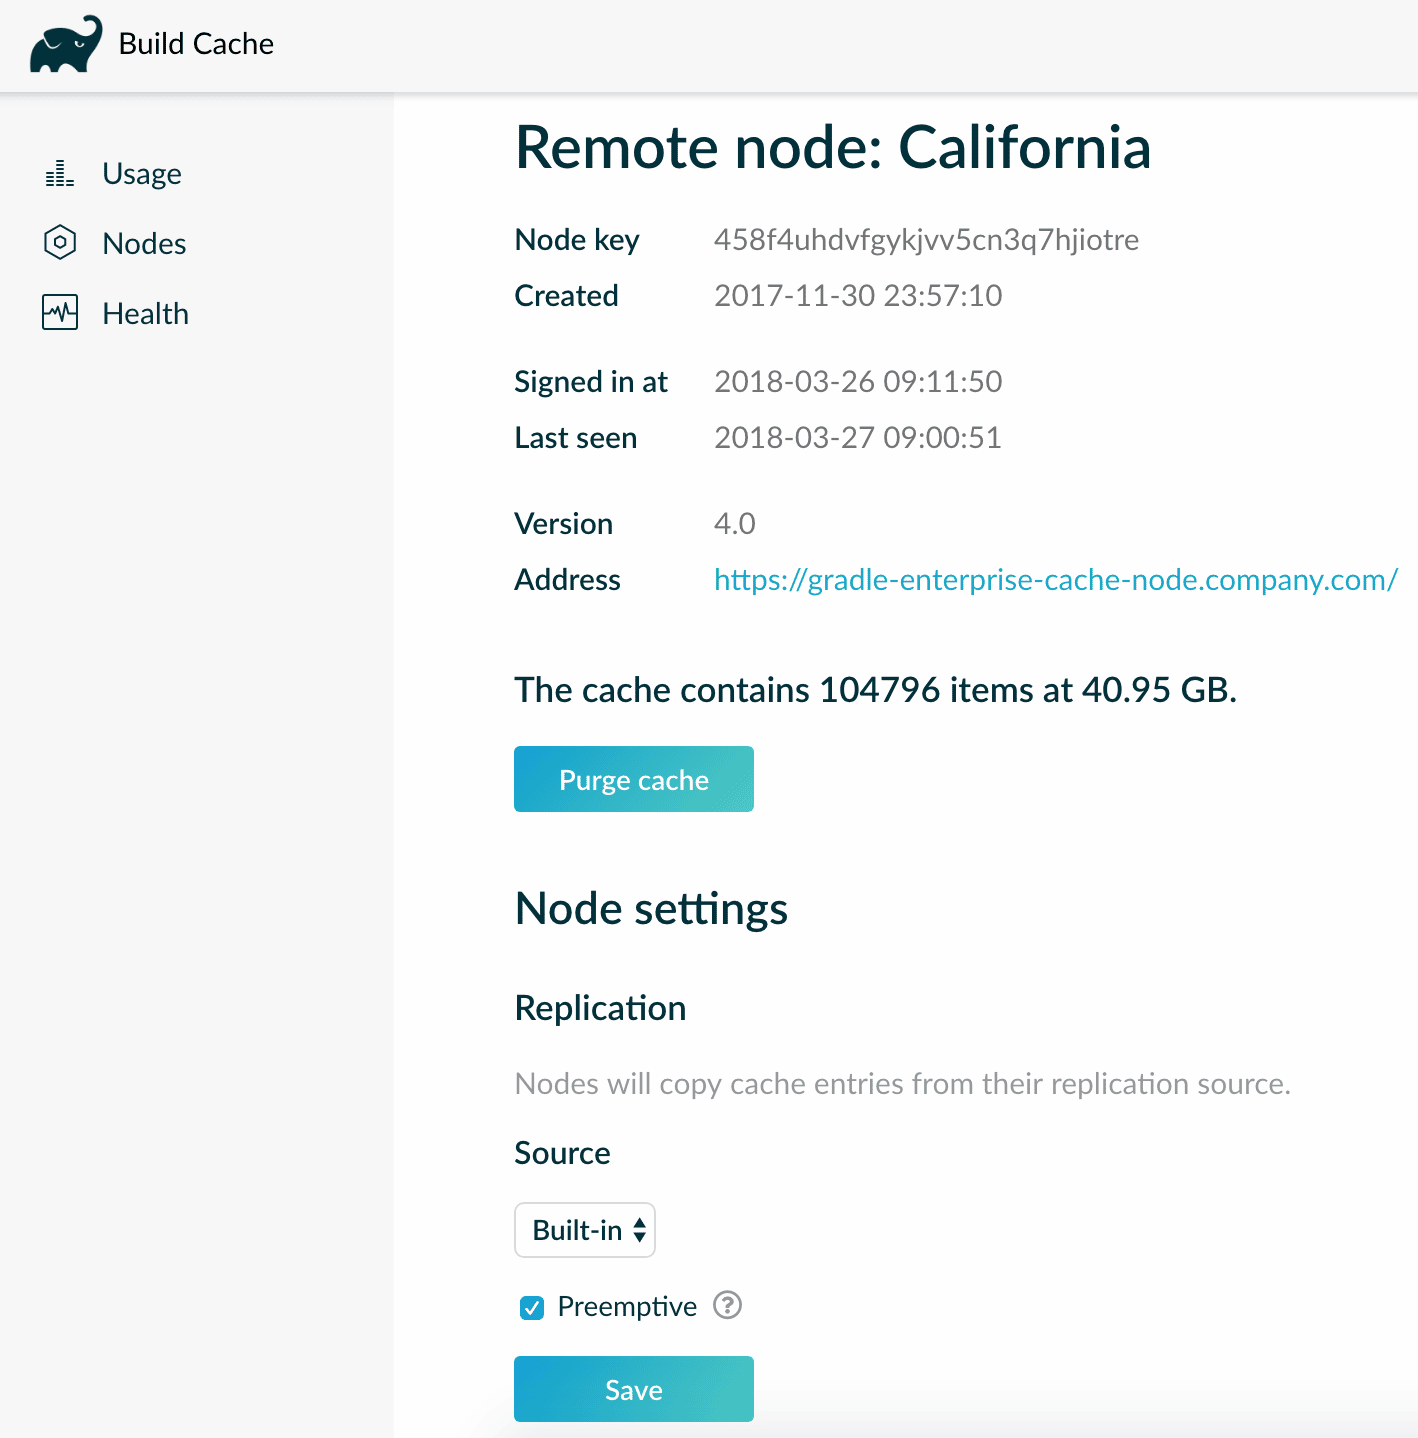
When preemptive replication is enabled, nodes will copy cache entries from their replication source as soon as they are added. This avoids having to wait for the copy when the cache entry is requested for the first time by a build, as is the case when using the default on-demand replication strategy.
Preemptive replication is not enabled by default. It must be enabled for each node that is replicating from another, via the node’s details page in the build cache admin section.
Monitor your build cache network
The new Health page in the build cache admin section of Gradle Enterprise provides an overview of the operational status of your build cache network.
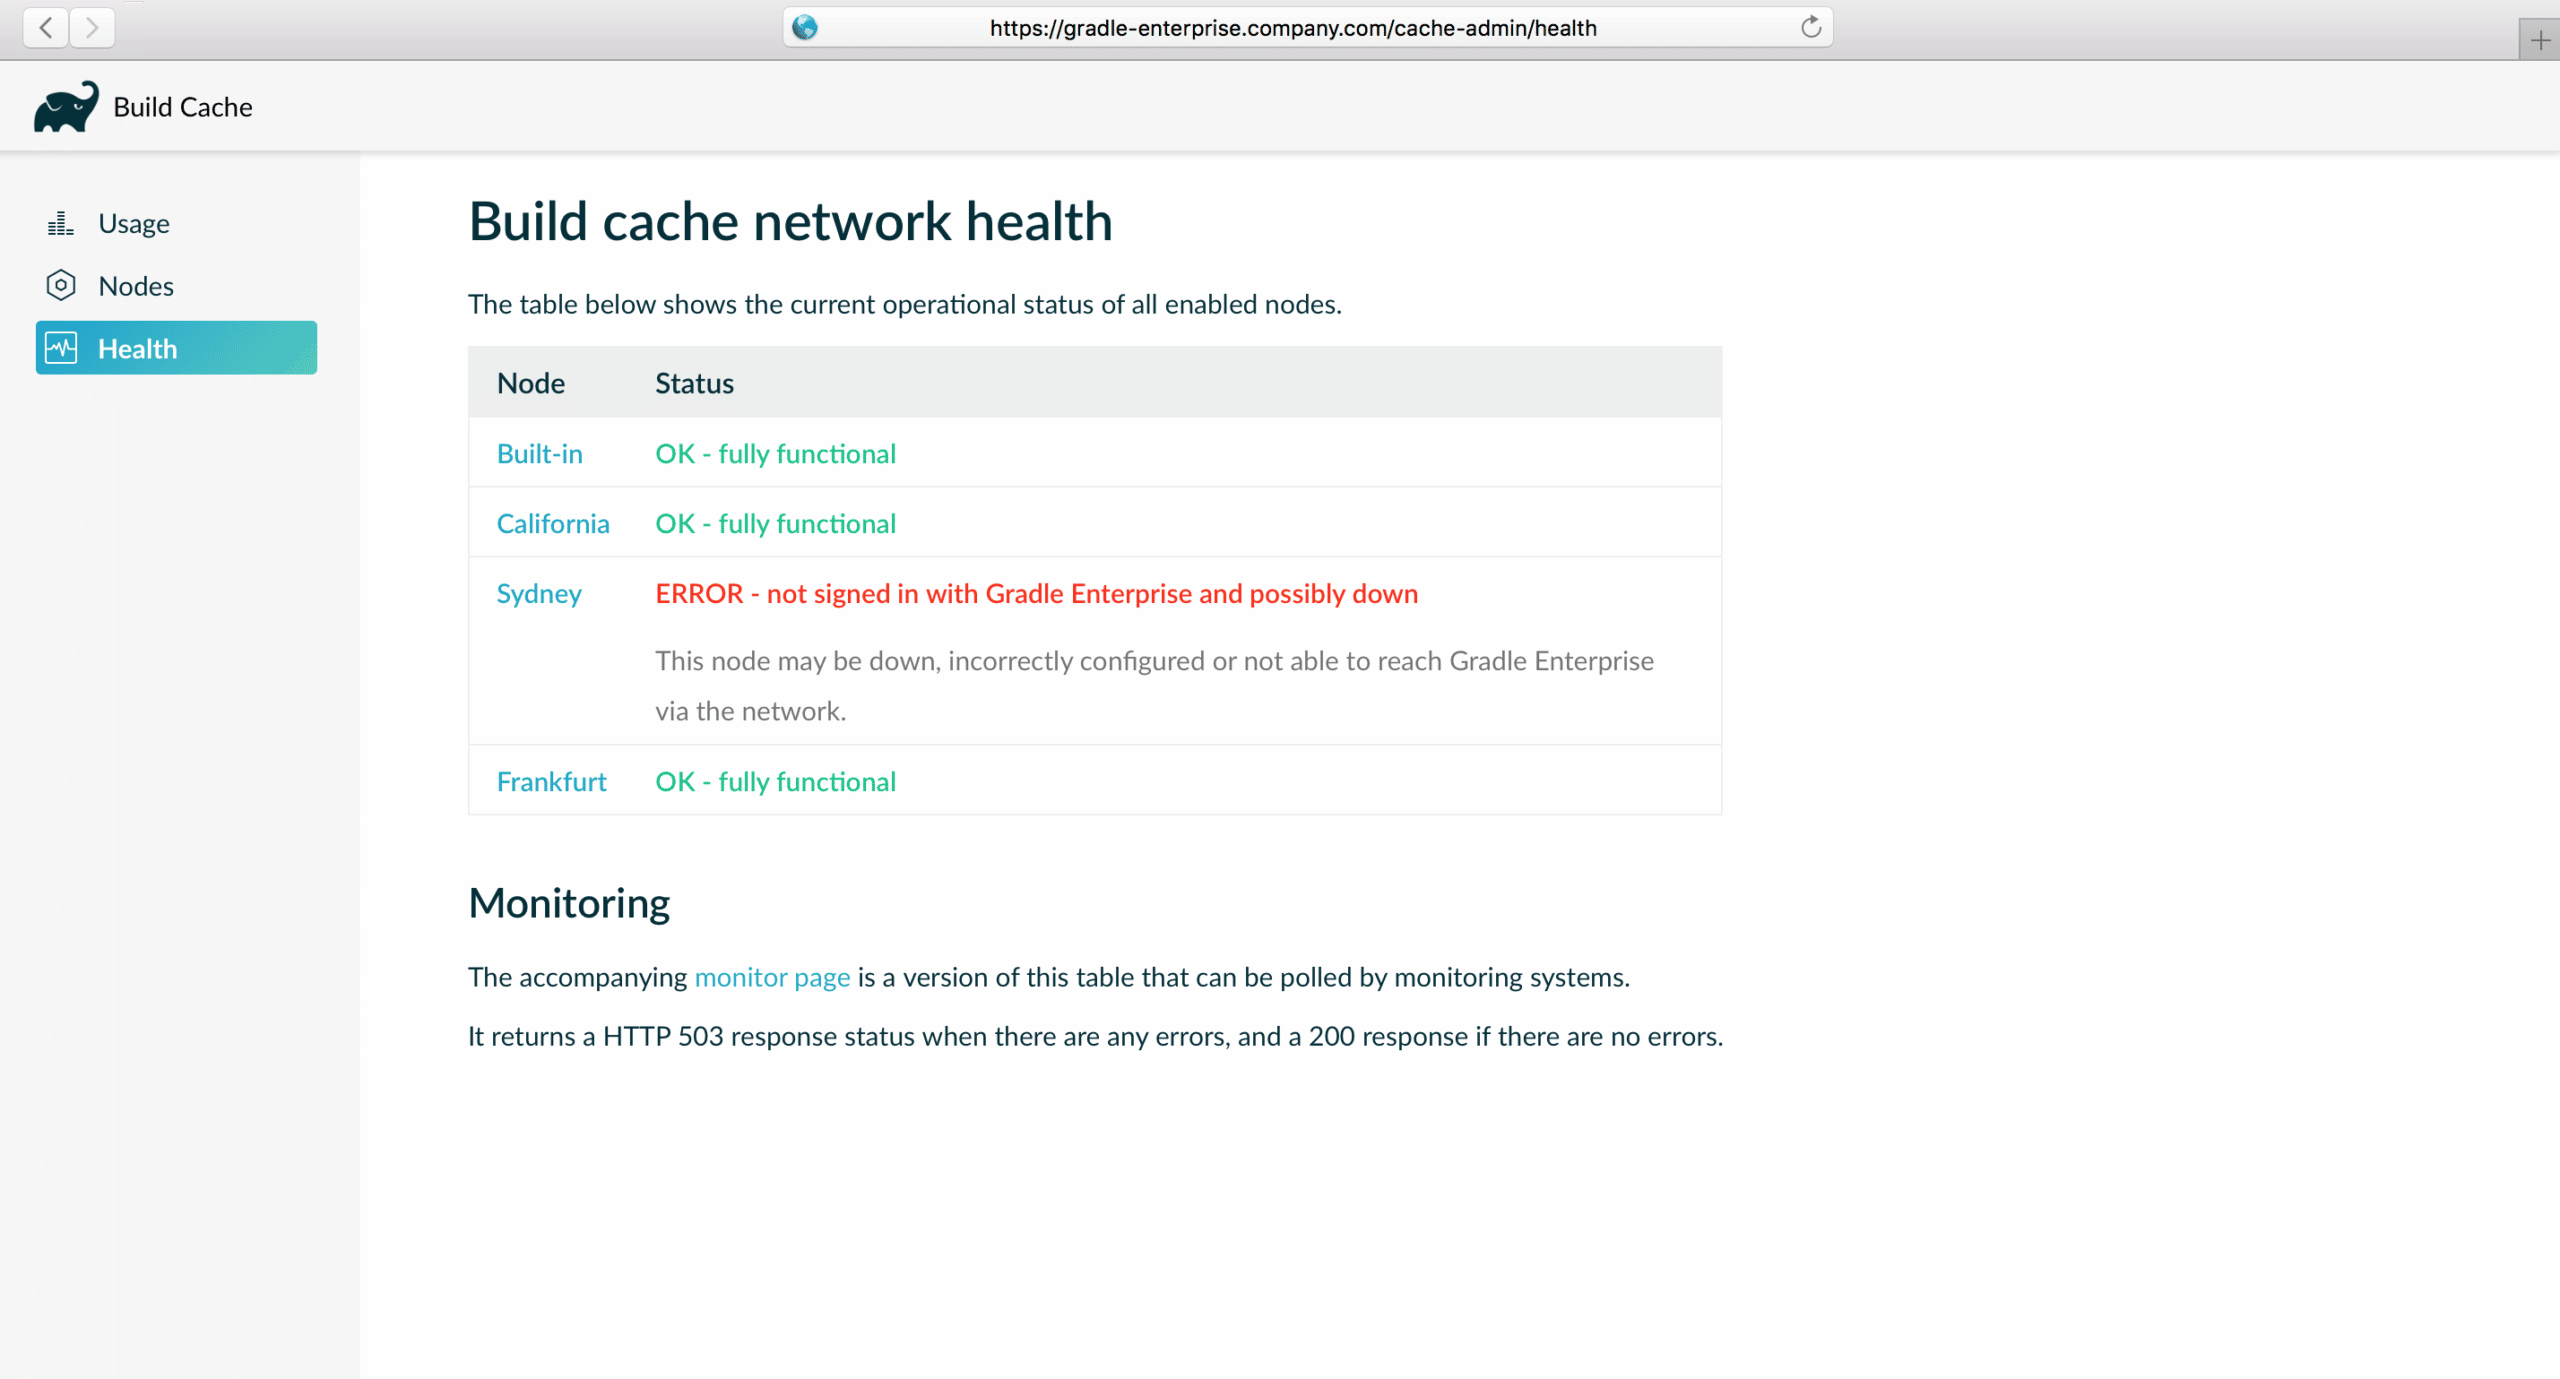
This makes it easier to rectify problems by seeing the status of each node in one place, and to verify that there are no problems.
Proactive alerting is supported by having your organization’s system monitoring tool poll the corresponding /cache-admin/health/monitor endpoint. It provides the status of the nodes in plain text, and responds with a 503 HTTP status code if there are any errors, which will be interpreted as an error state by your monitoring tool.

Limit disk usage by automatically deleting old build scans
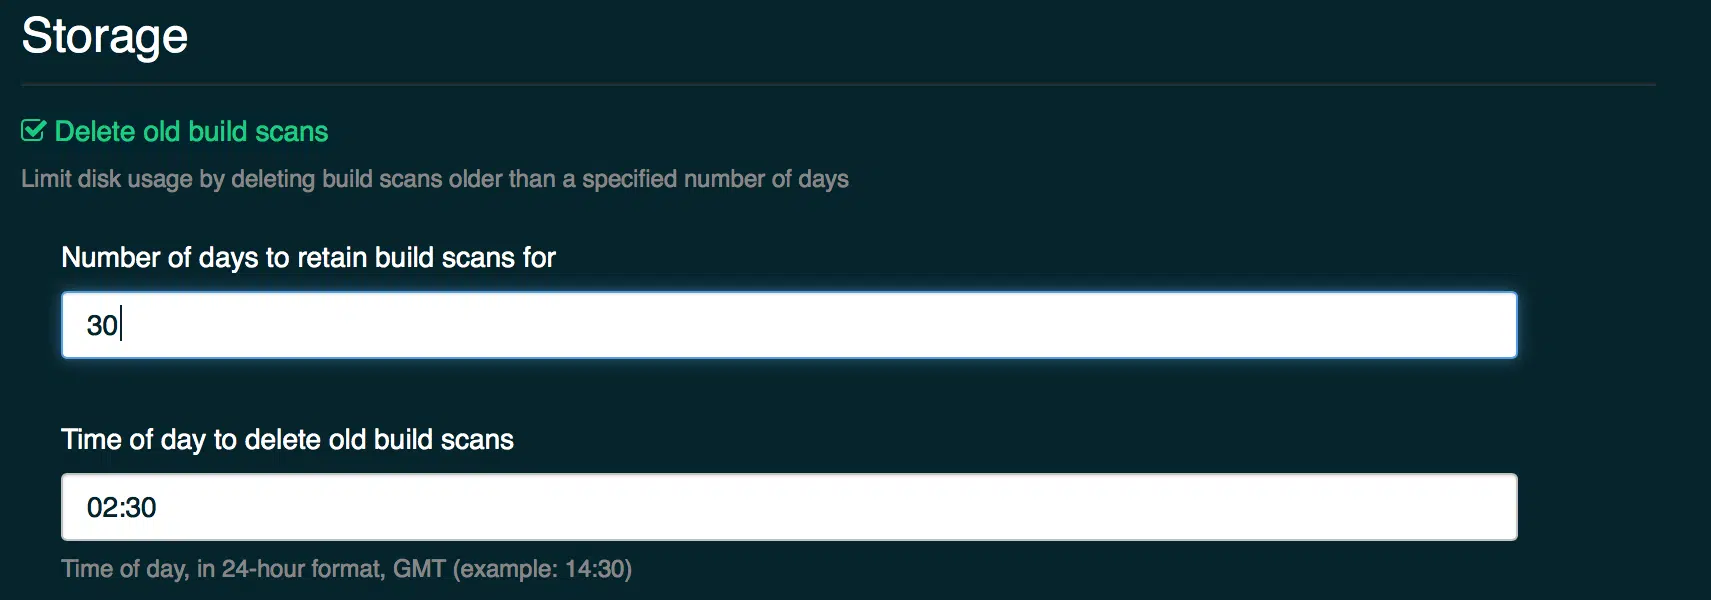
Captured build scans are stored on the Gradle Enterprise server’s disk. In order to limit the disk space used by Gradle Enterprise, you can now elect to have build scans older than a specified number of days automatically deleted.
This new setting is available under the Storage section of the admin console.
Please see the managing disk usage section of the admin manual for more information on this topic.
Faster and simpler backups
The backup process has been rebuilt to be faster and simpler to operate. Previous backup archives remain compatible.
Please note, the previous backup configuration is not automatically migrated. See the upgrade notesfor more information.
Quickly view the console log of a failed task
When a build fails due to a task failing, a convenient link is now presented next to the failure description that reveals the console log from just that task.
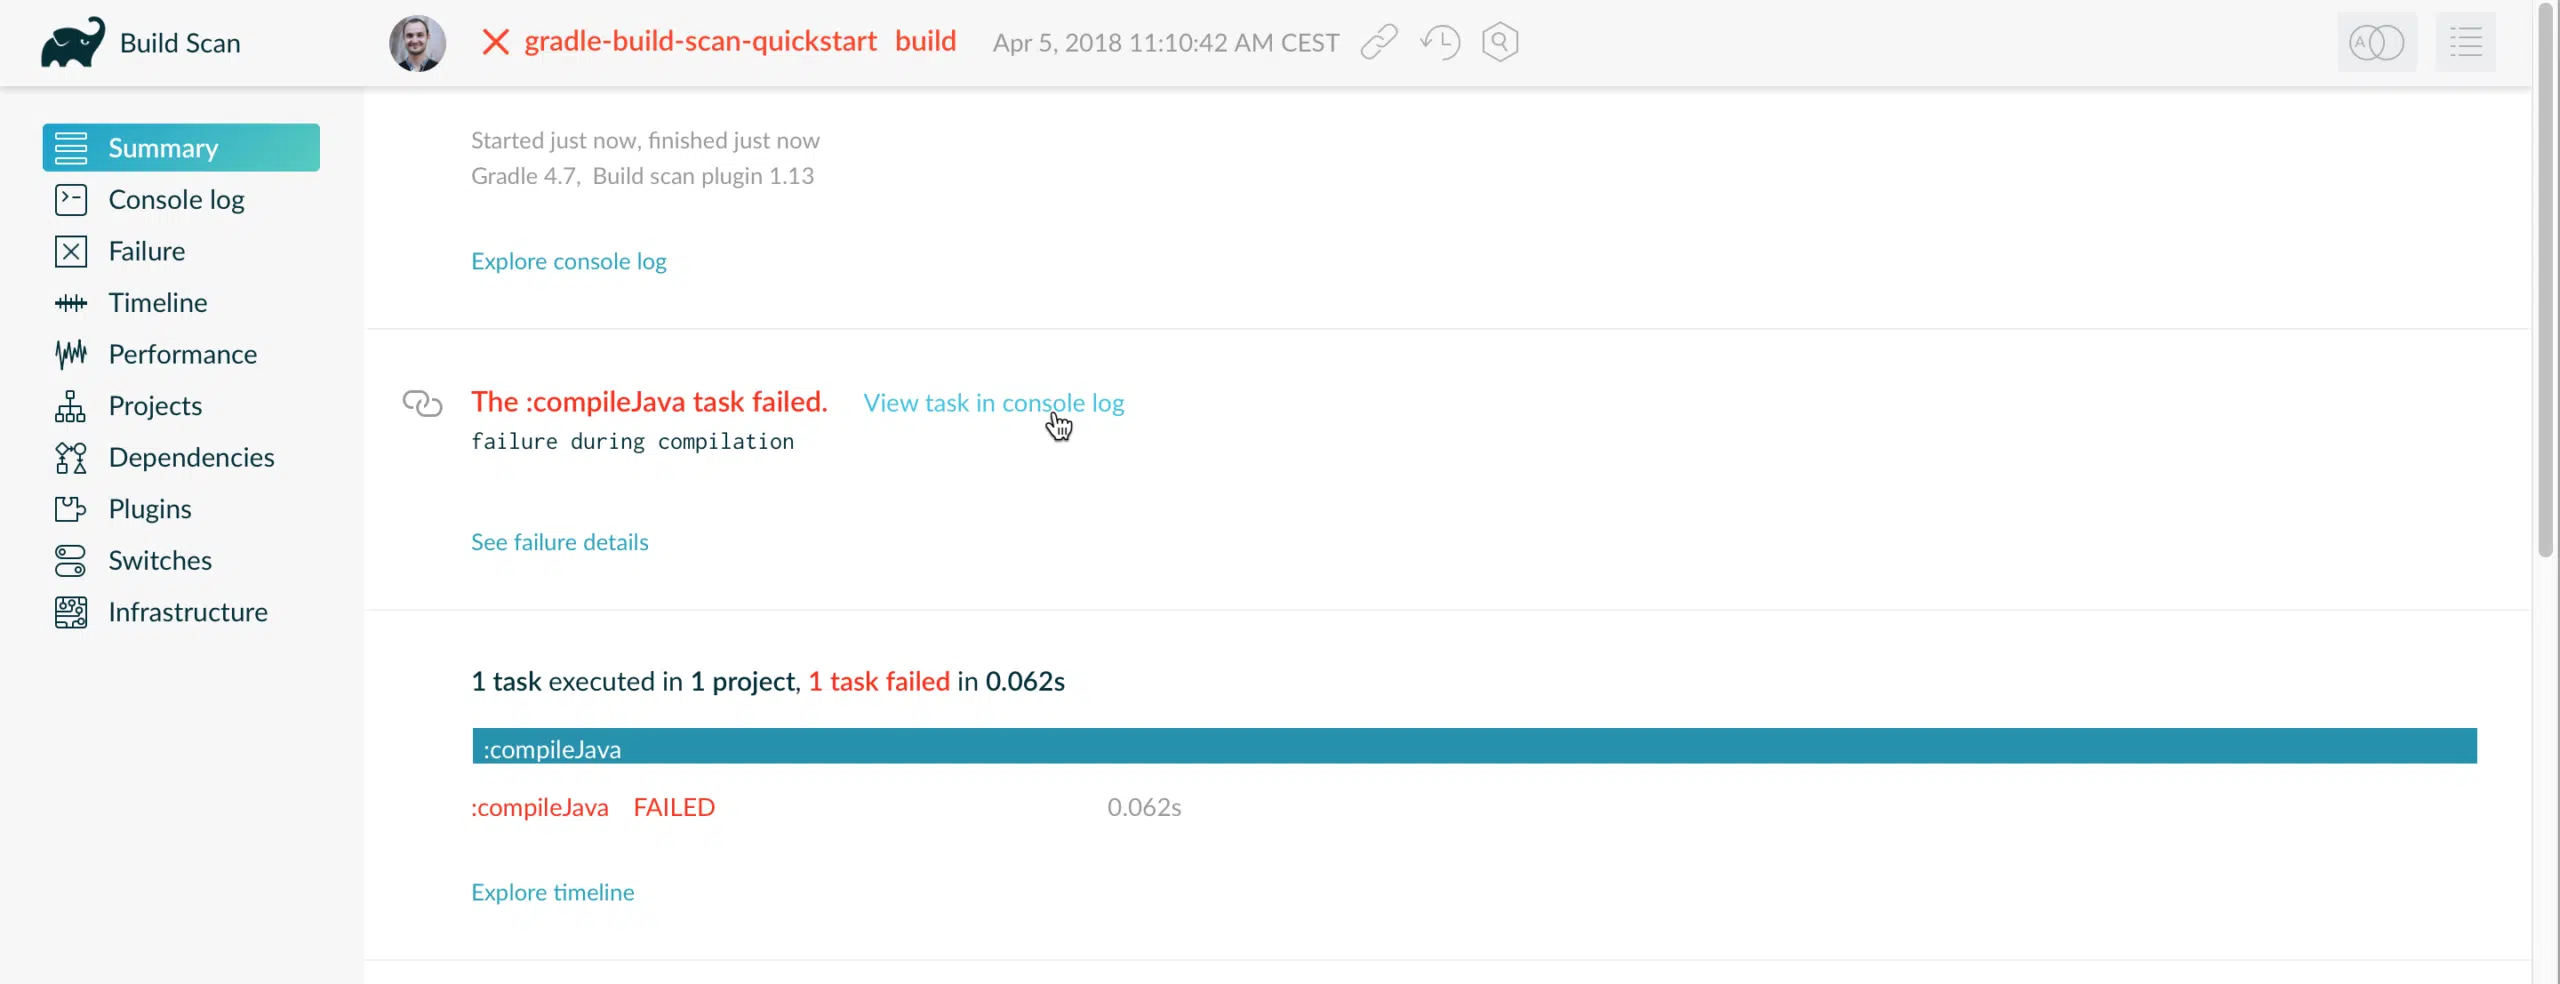
Many tasks provide failure diagnostics in their console log. This link makes it much faster to access this information in a build scan.
View console log for a task or task type
The existing Console log section now provides a task path and task type filter for isolating specific task log.

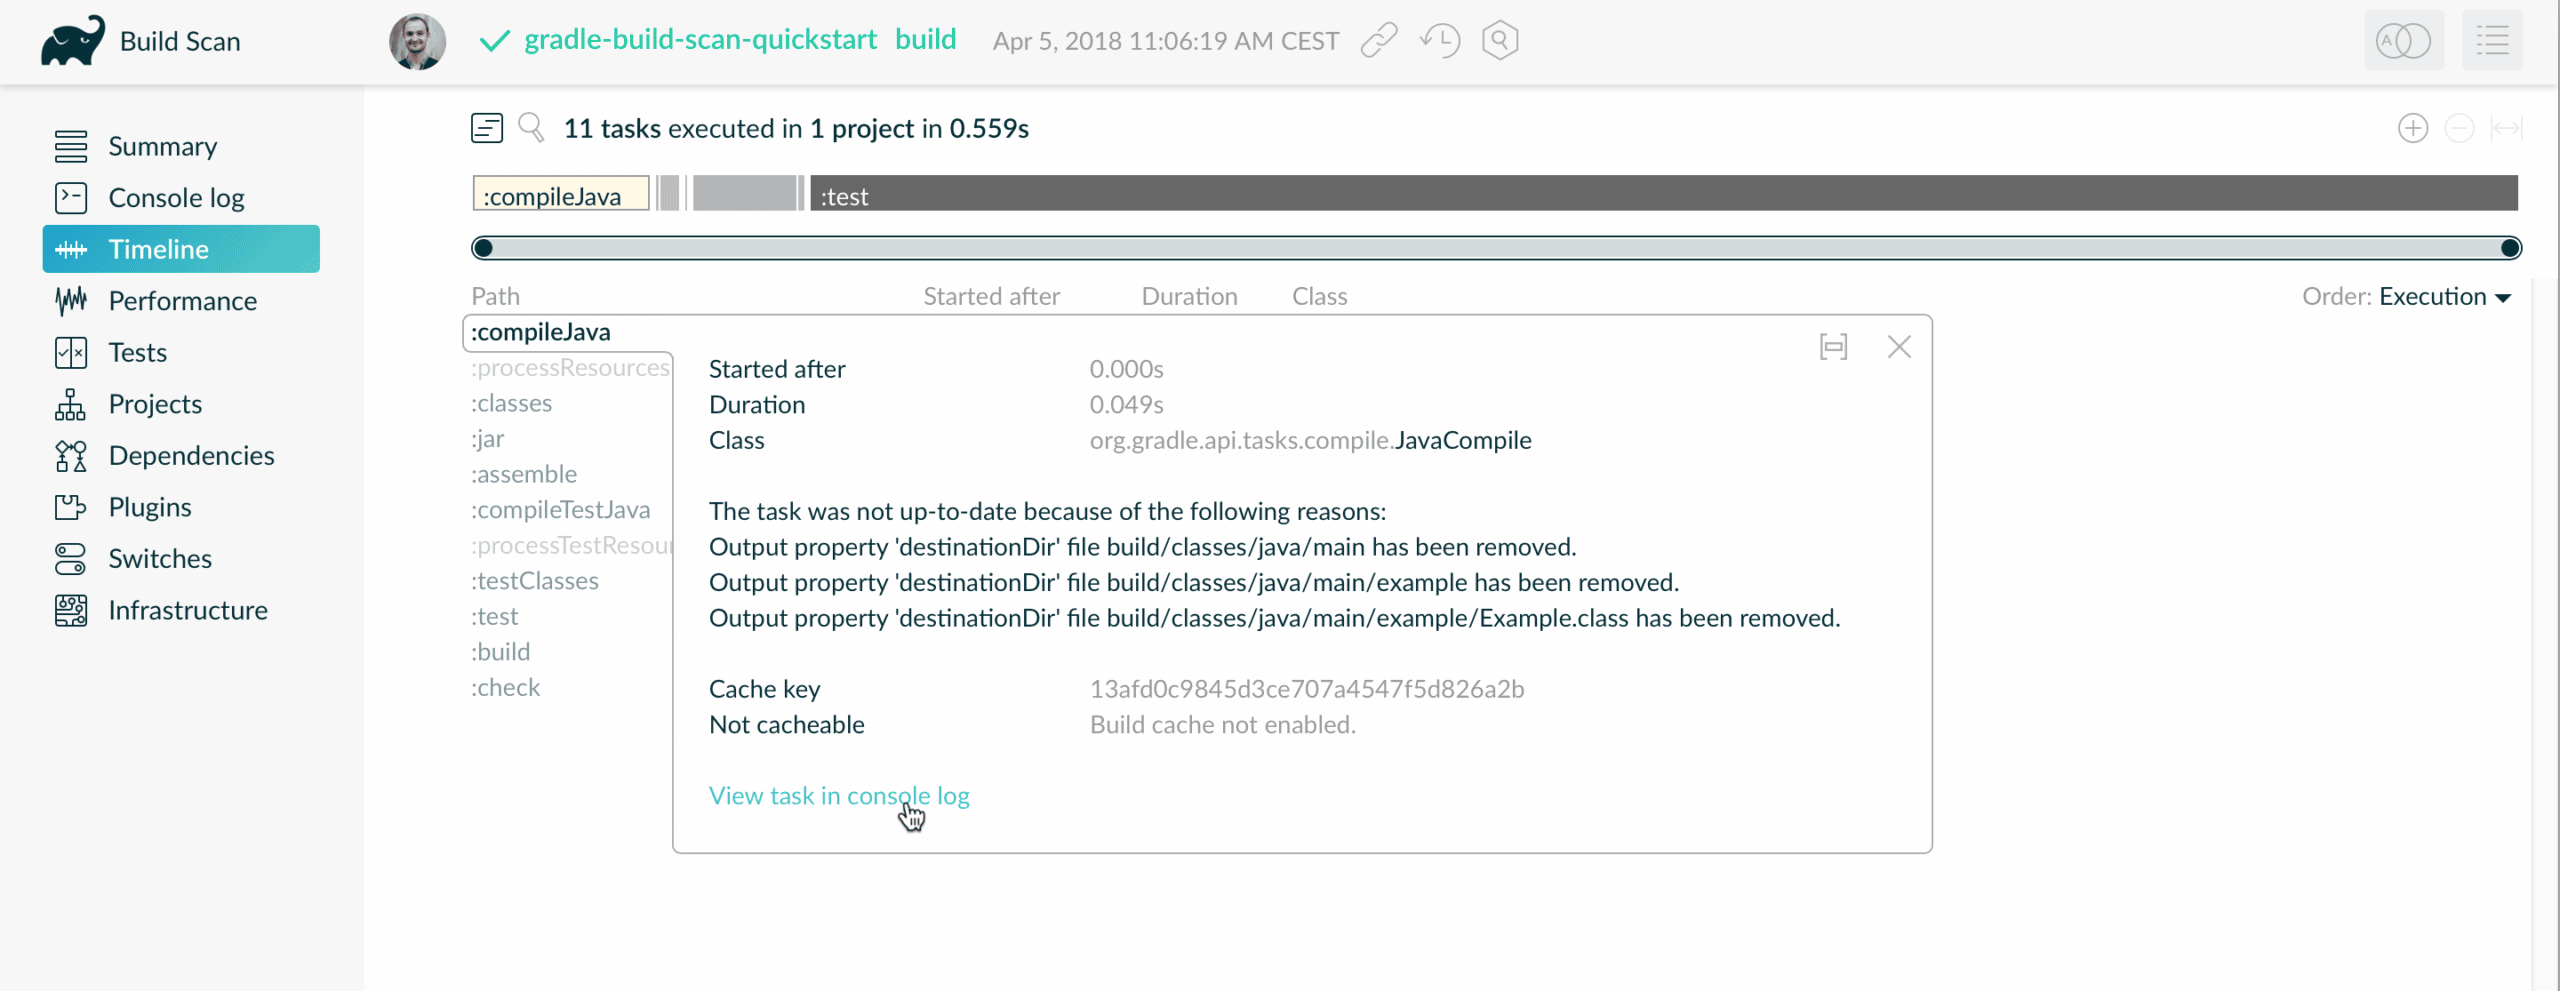
Additionally, when viewing a particular task within the Timeline section, there is now a link for accessing the console log of that task.
New Gradle Enterprise front page
Previously, visiting / of a Gradle Enterprise server redirected to the /scans page. Now, a new landing page is shown.
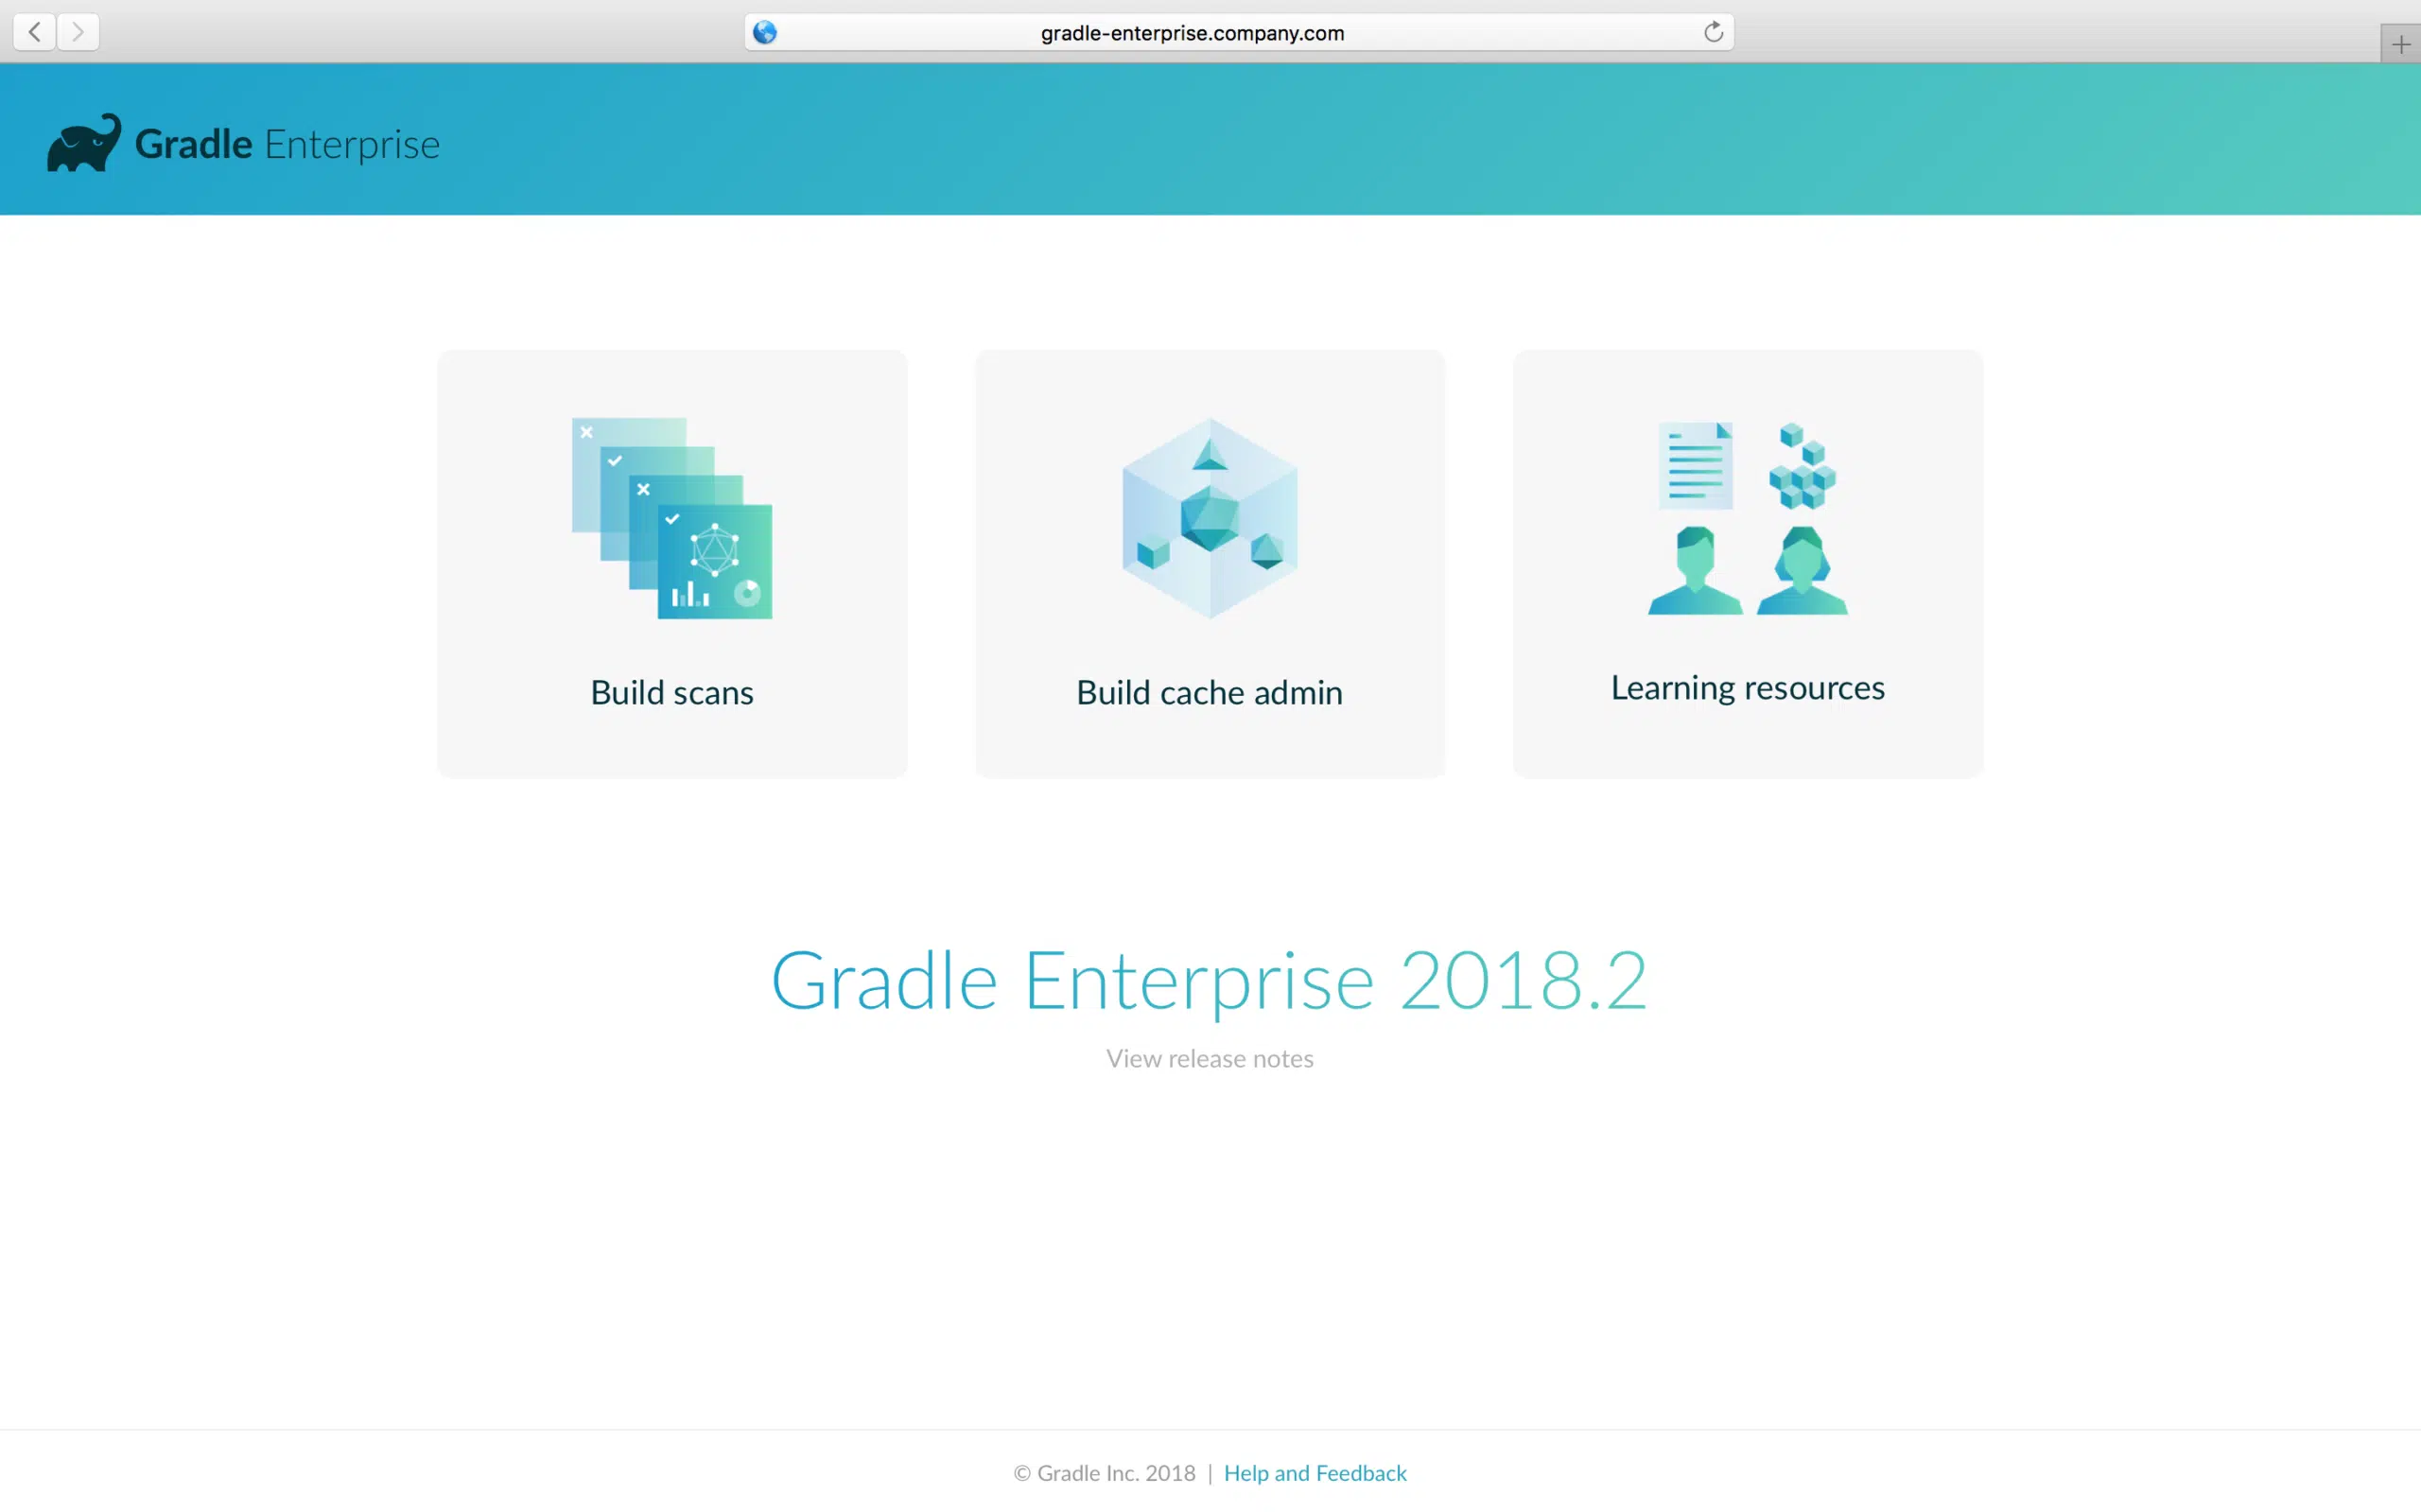
Clicking the Build scans button will take you through to /scans.
Upgrade notes
New scheduled backup configuration options
This release includes changes to the backup process. If you have previously configured scheduled backups, you will need to reconfigure them.
Please consult the Backup and disaster recovery section of the admin manual for information on configuring a backup schedule.
Performance dashboard data indexing
The performance dashboard requires indexing existing build scans. Gradle Enterprise will perform this indexing in the background when starting 2018.2 for the first time. This may take a few hours for installations with many 100,000s of build scans. While this is occurring, performance of the system may be slightly degraded.
Build scans that are not yet indexed will not be visible with the performance dashboard. More recent build scans will be indexed first, making them available sooner.
Changes
- [FIX] UI improvements
- [FIX] Some application settings from earlier versions are not respected
- [FEATURE] Build performance dashboard
- [FEATURE] Preemptive build cache replication
- [FEATURE] Build cache network health monitoring
- [FEATURE] Build scan data retention policy
- [FEATURE] View console log for specific tasks and task types
- [FEATURE] Improved backup process
